Dashboard
Monitoring System Data Query Instructions
Default Time Granularity for Historical Data
The relationship between the query time range and the returned data interval is as follows:
| Time range | Interval |
|---|---|
| (0, 3h] | 60s |
| (3h, 24h) | 300s |
| [24, 7d] | 3600s |
| (7d, 31d) | 10800s |
| [31d, ~) | 86400s |
s represents seconds, h represents hours, and d represents days.
Note: For traffic detail data, the interval is 300s when the time range is (0, 24h).
Latest Data Description
Current values displayed in page lists, such as device CPU usage, port throughput, and link packet loss rate, are calculated from the latest data point within the last 5 minutes from the query time. If there is no data within 5 minutes, the value is displayed as empty.
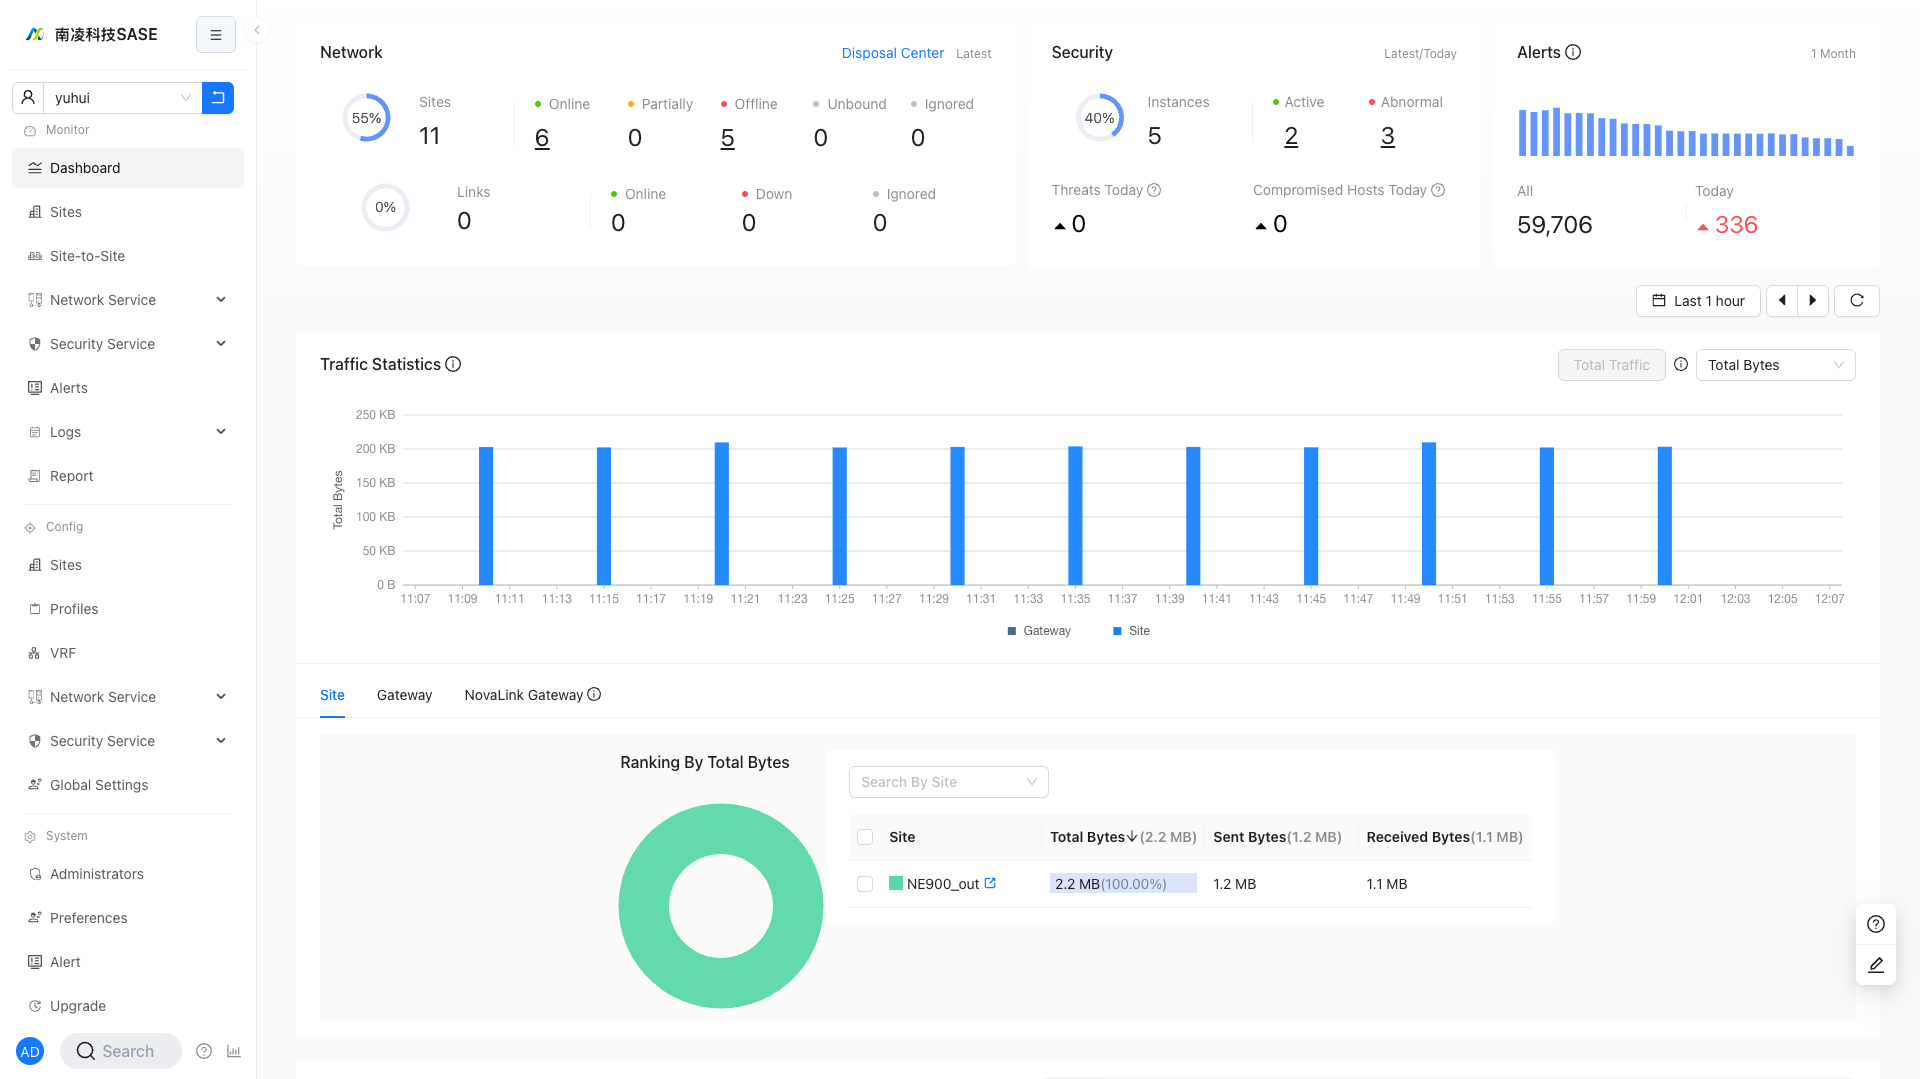
Dashboard
"Tenant"→"Monitor"→"Dashboard"
- Sites/links
- Security instances/statistics
- Threats Today
- Compromised Hosts Today
- Alerts
- Total alerts in one month
- Daily increase within one month
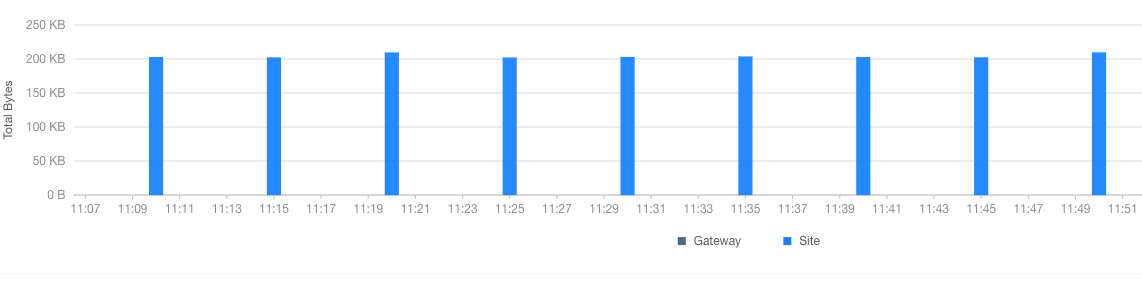
- Network Traffic
- Global traffic
- Traffic type
- Site
- Nova Gateway connection
- Zero Trust access gateway
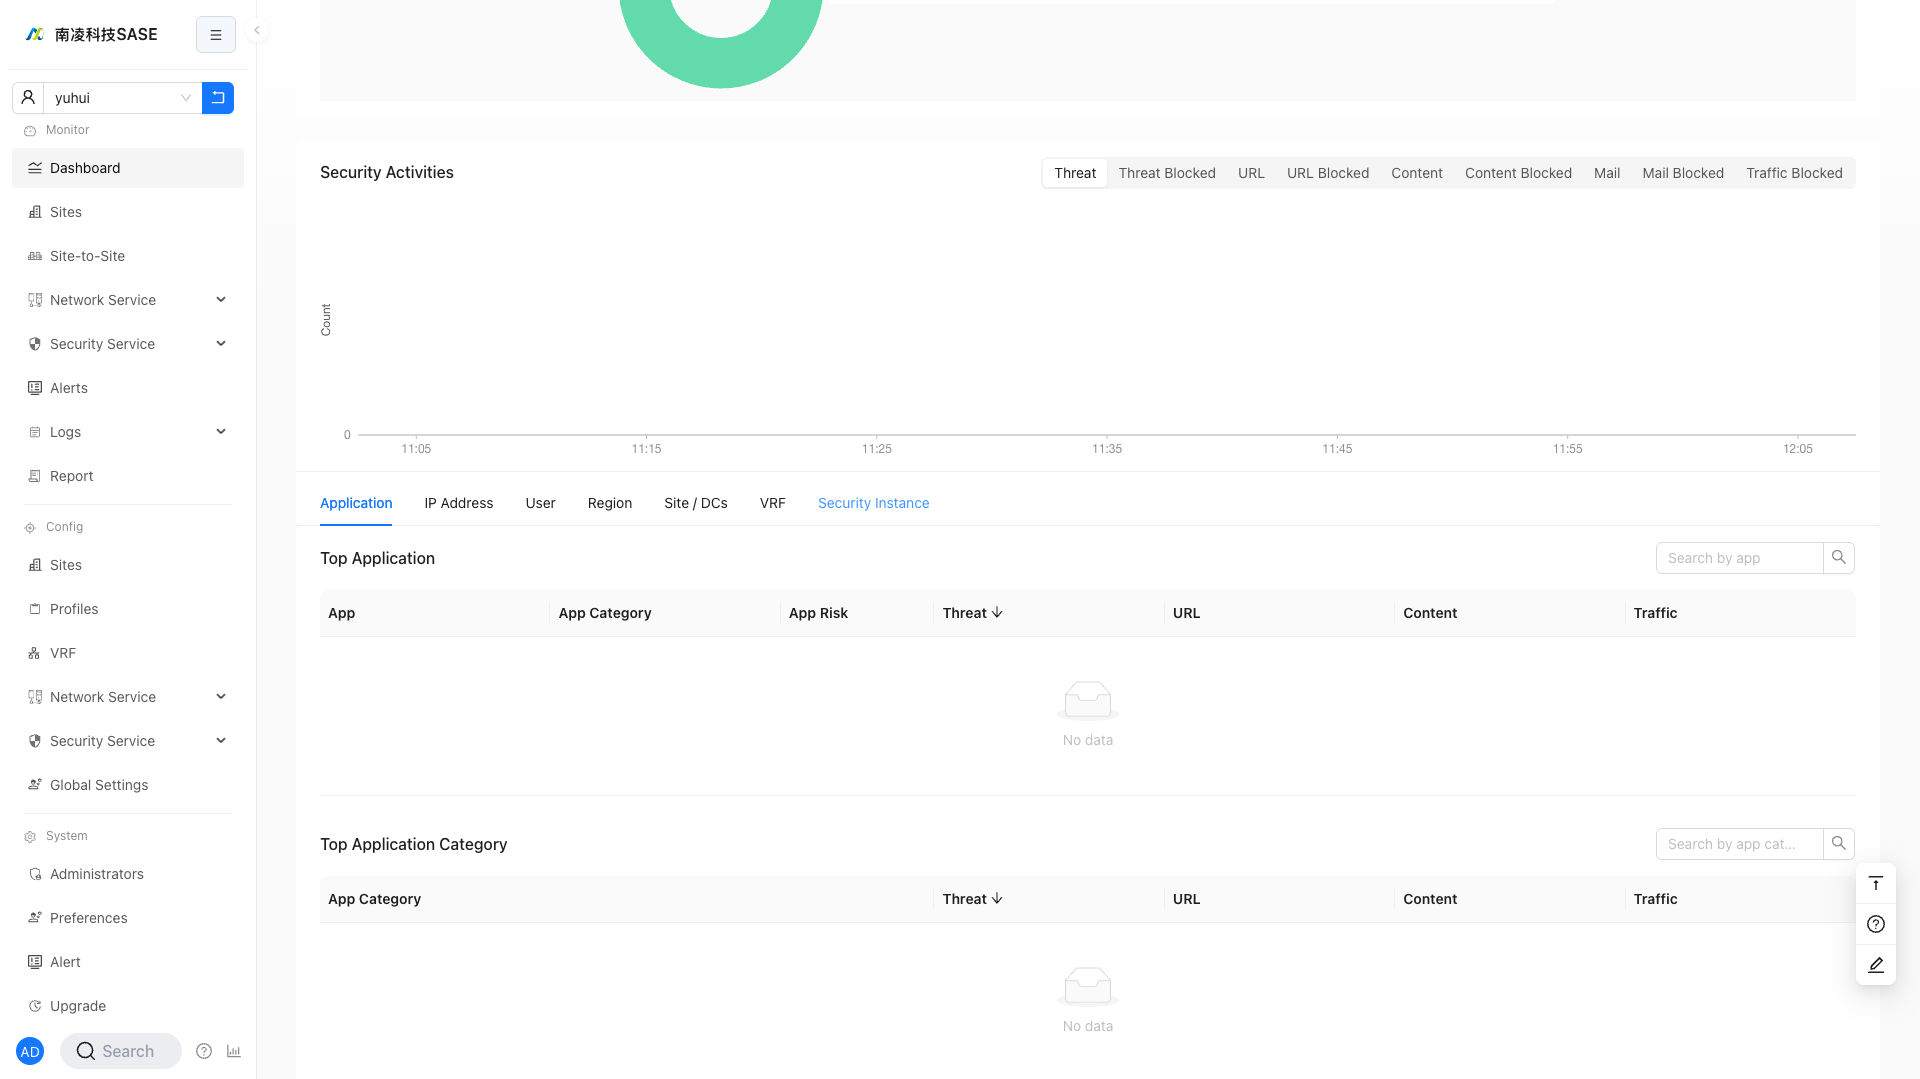
- Security Activities
- Type
- Total threats
- Blocked threats
- Total URLs
- Blocked URLs
- Total file content events
- Blocked file content events
- Total emails
- Blocked emails
- Blocked traffic
- Top N type
- Application
- IP address
- User
- Country/Region
- Site
- VRF
- Security Instance
- Type
Network Traffic
- Global traffic
- Only global traffic is supported here.
- For more detailed Network Traffic, see "Tenant"→"Monitor"→"Network Service"→"Network Traffic".
- You can view the Network Traffic of a certain site at the following location:
Control Time Precision
Users can drag the time selector to control time precision:
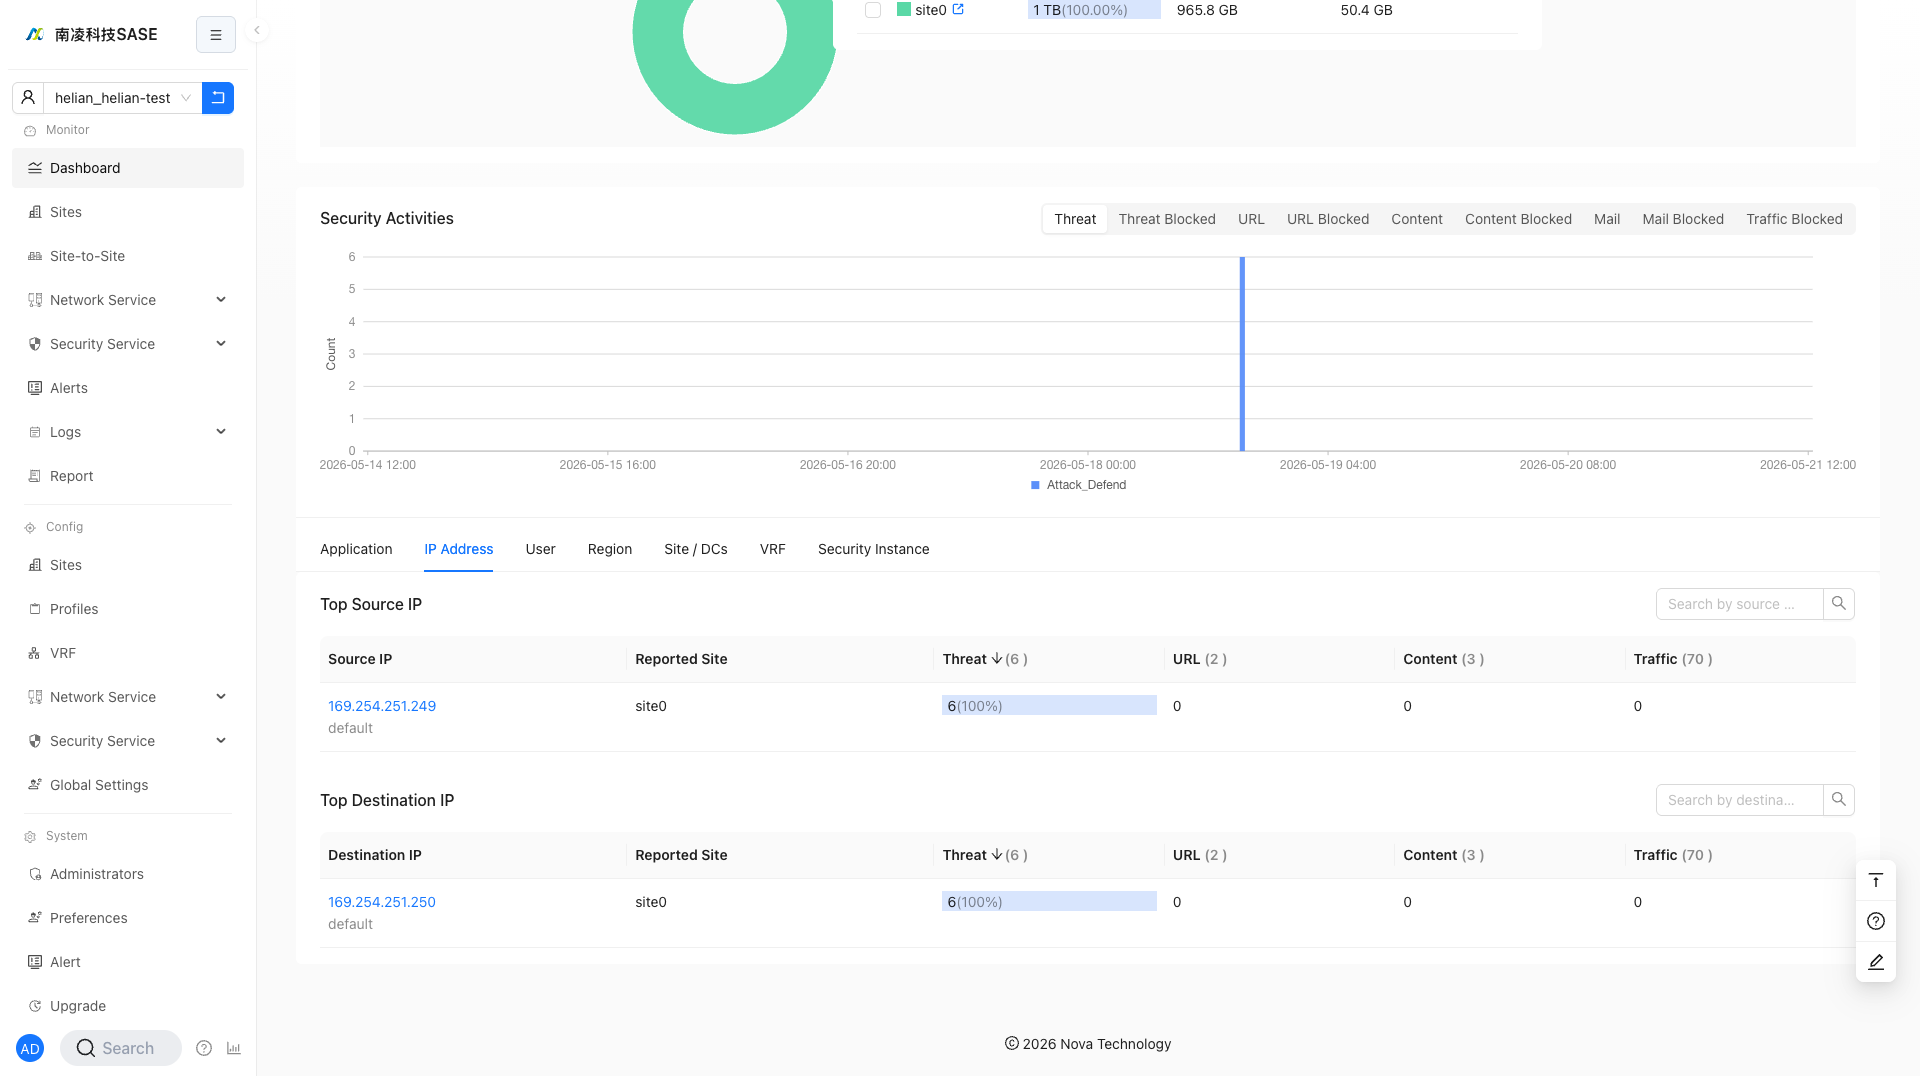
Security Activities
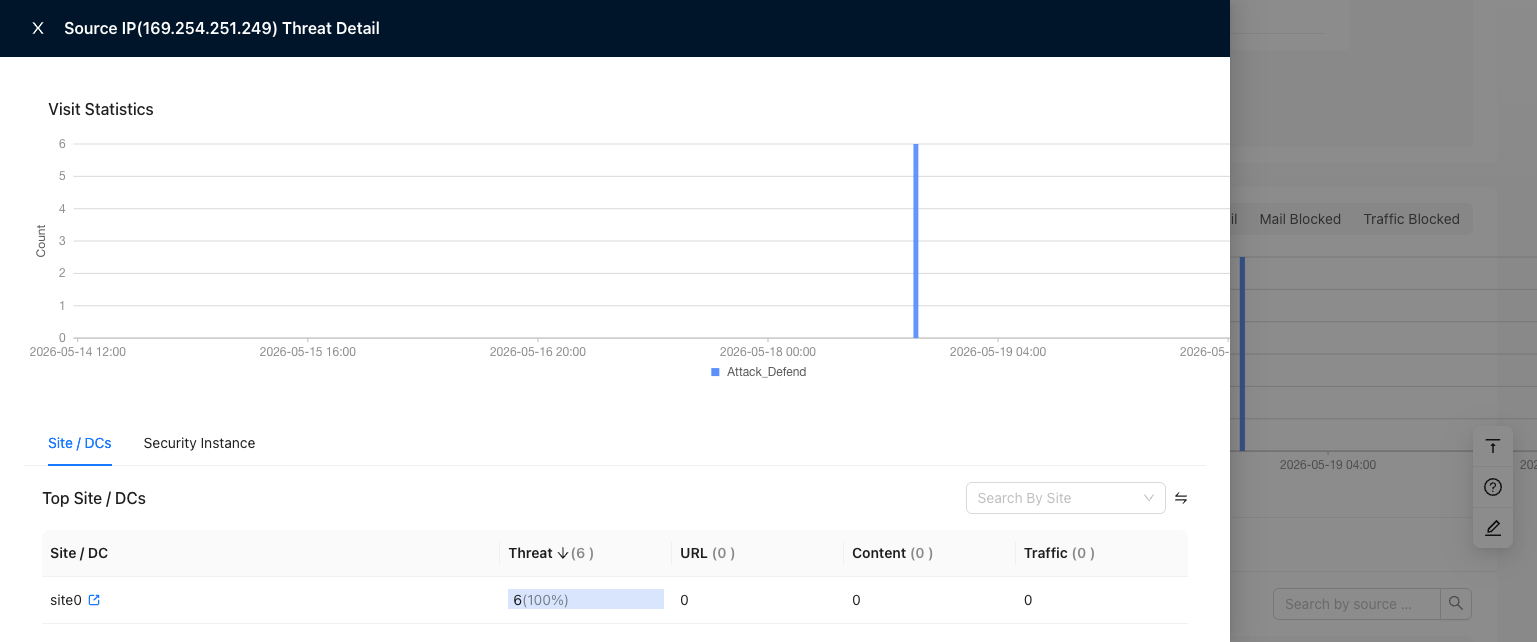
Source (Security Activities)
You can view the security status of source hosts, such as total threats, total URL alerts, and total file content alerts.
Click the "IP Address" tab, and then view the data in the "Source IP Visit Ranking" section, as shown below:
- Security activity details support querying data for the last 12 hours at most.

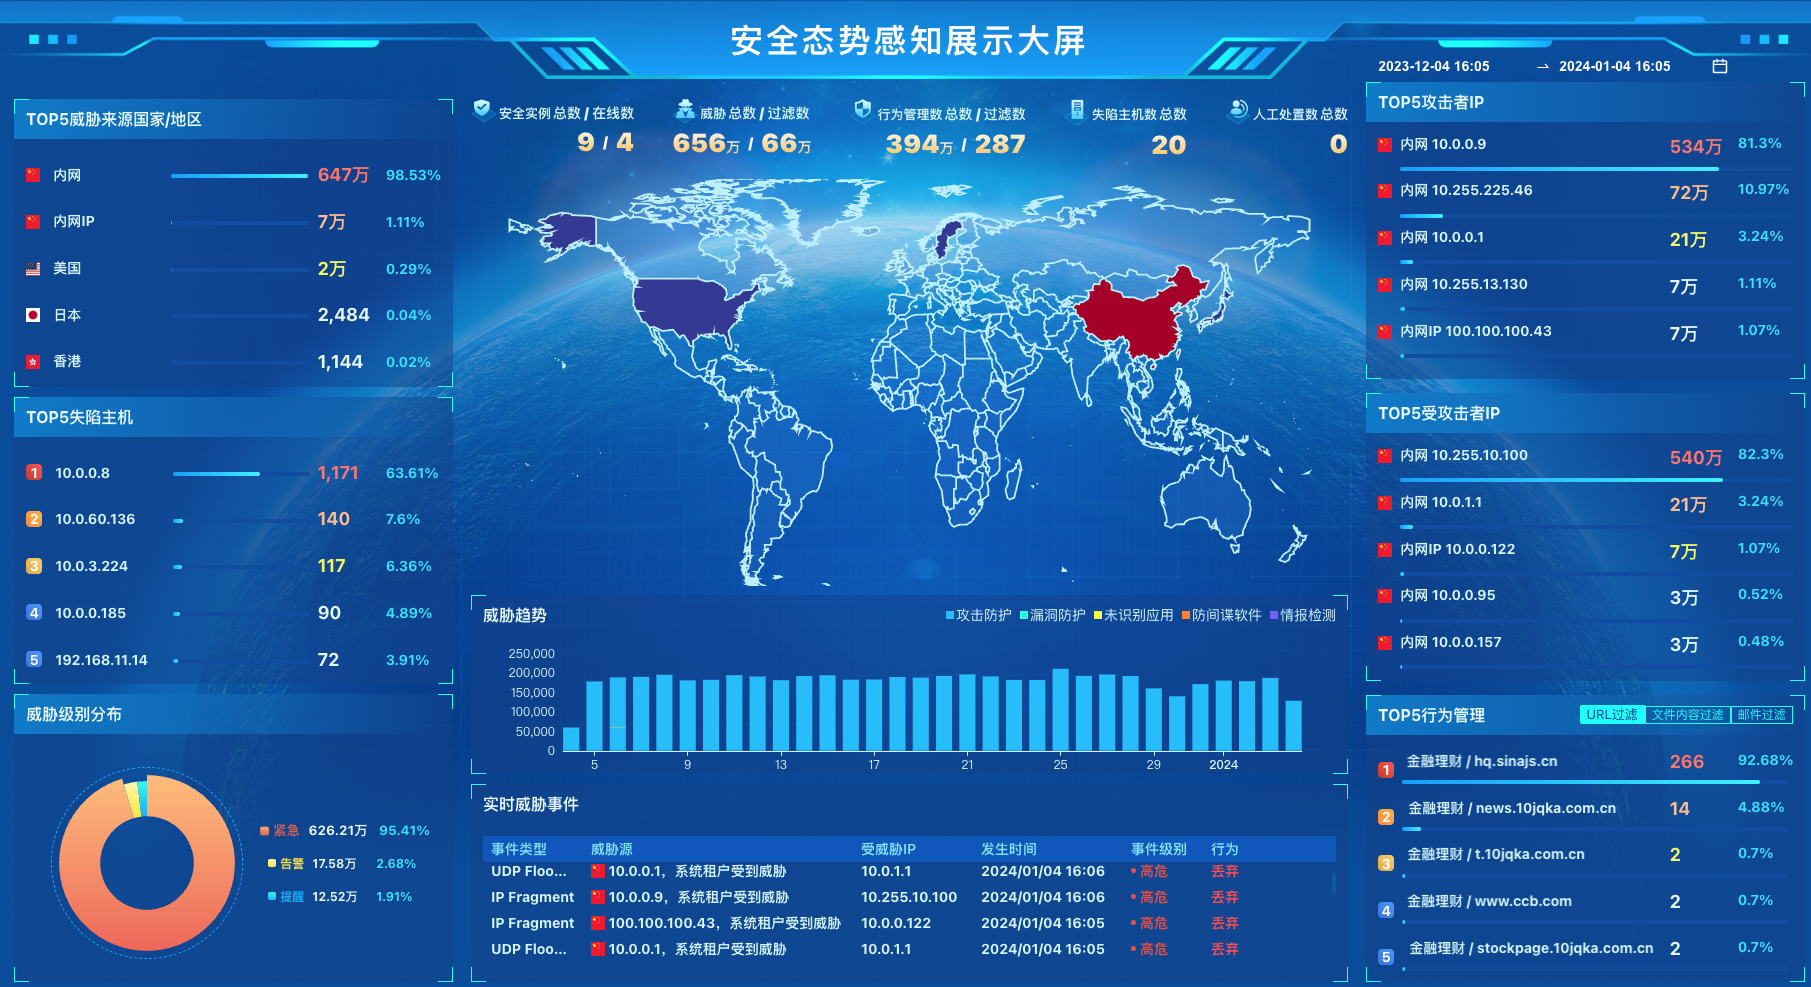
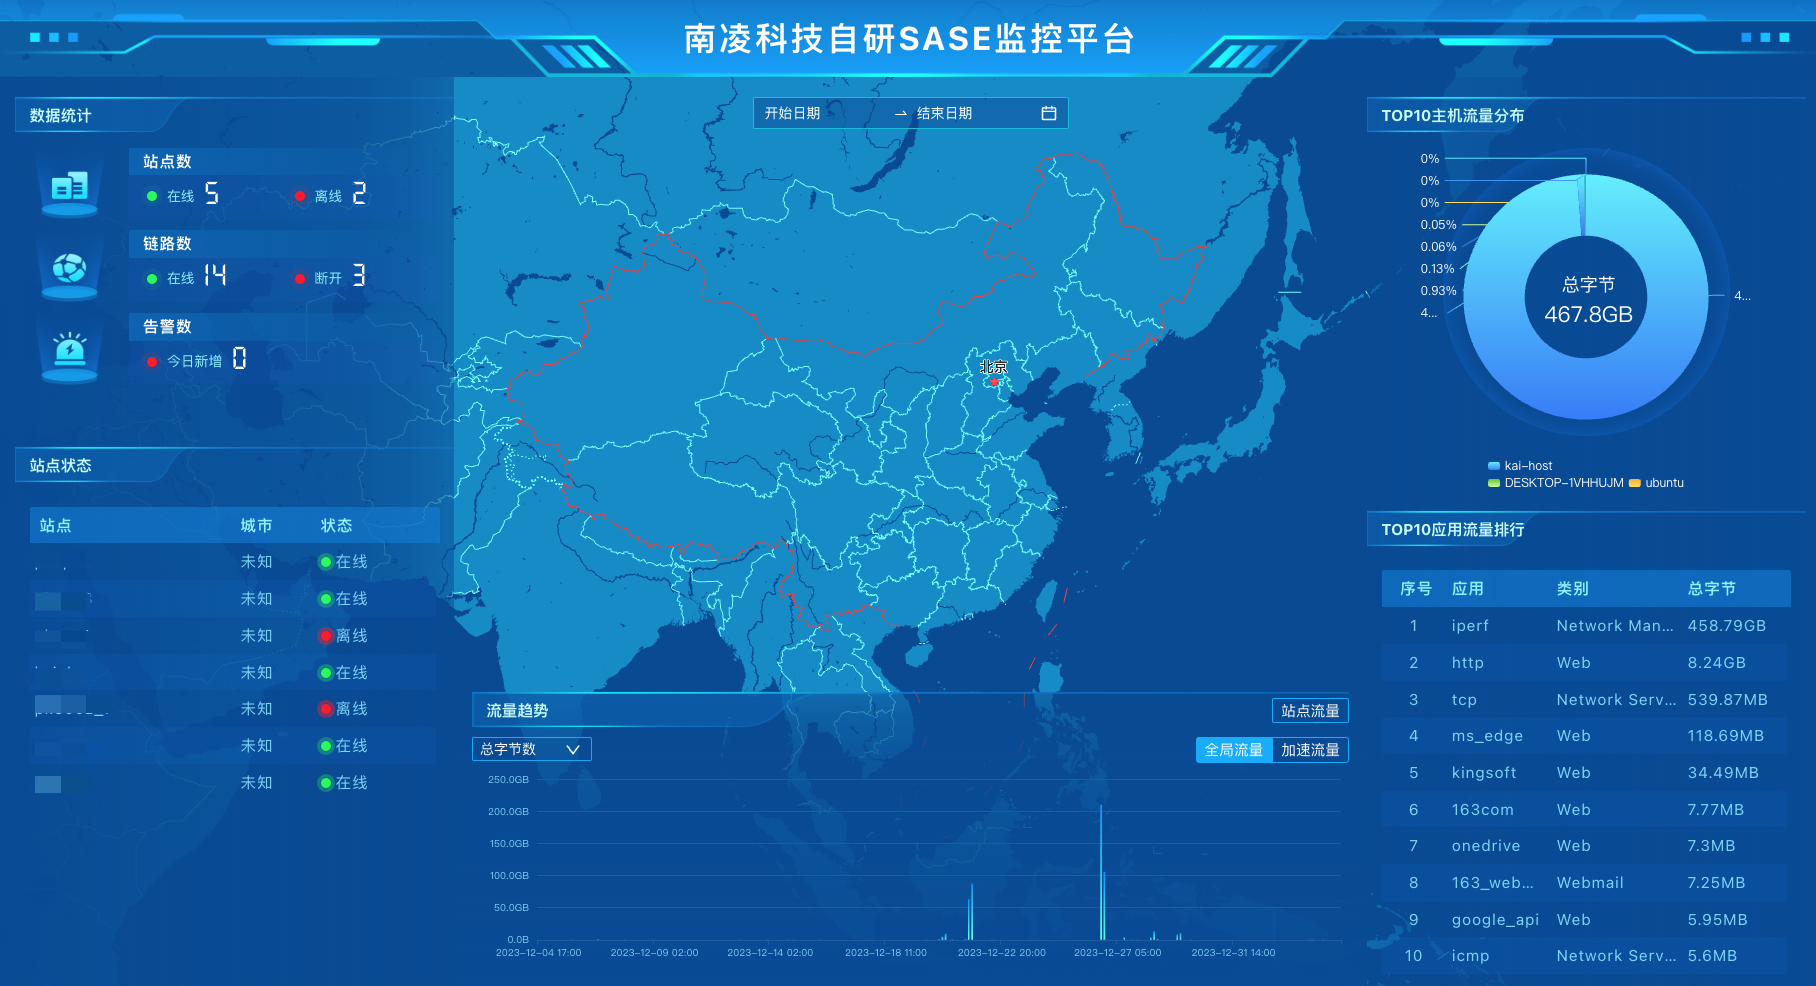
Large Screen
The large screen button is located on the sidebar or top bar, as shown below:
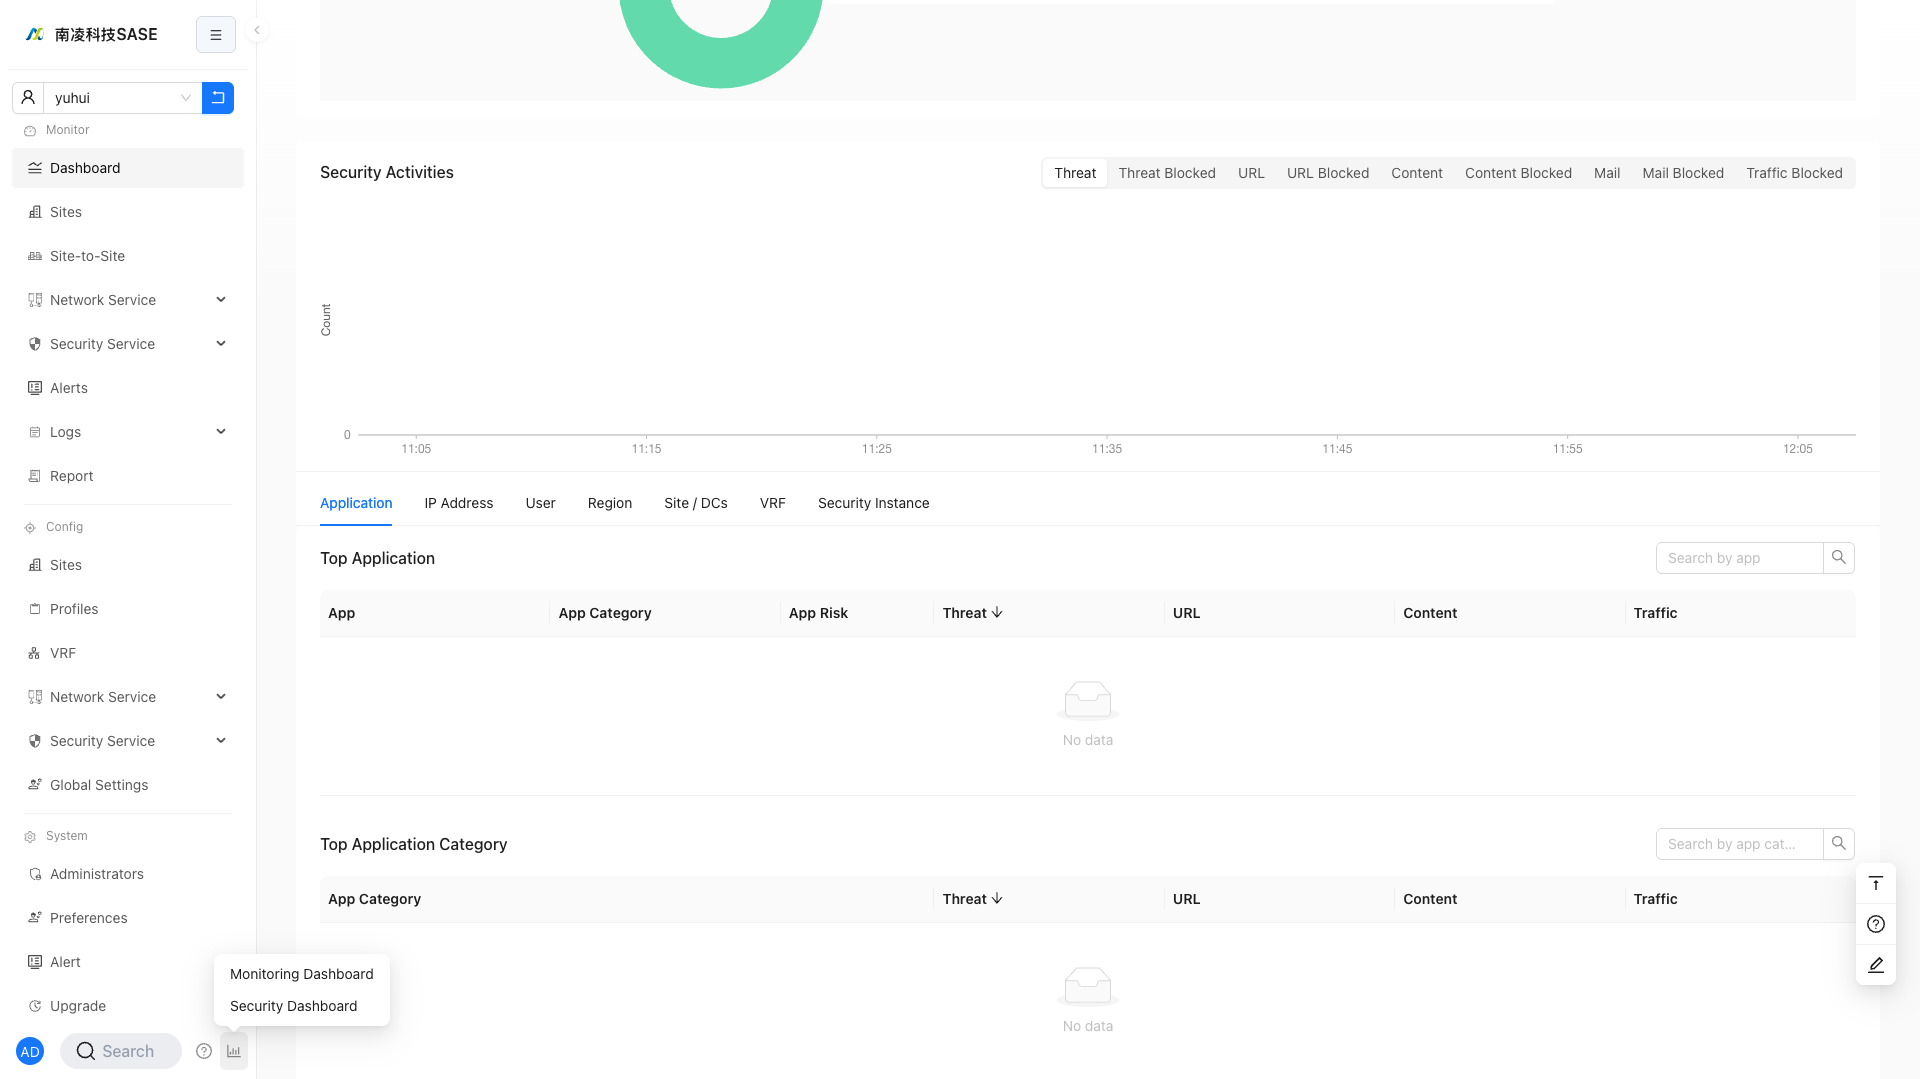
Monitoring Dashboard
Security Dashboard