Sites
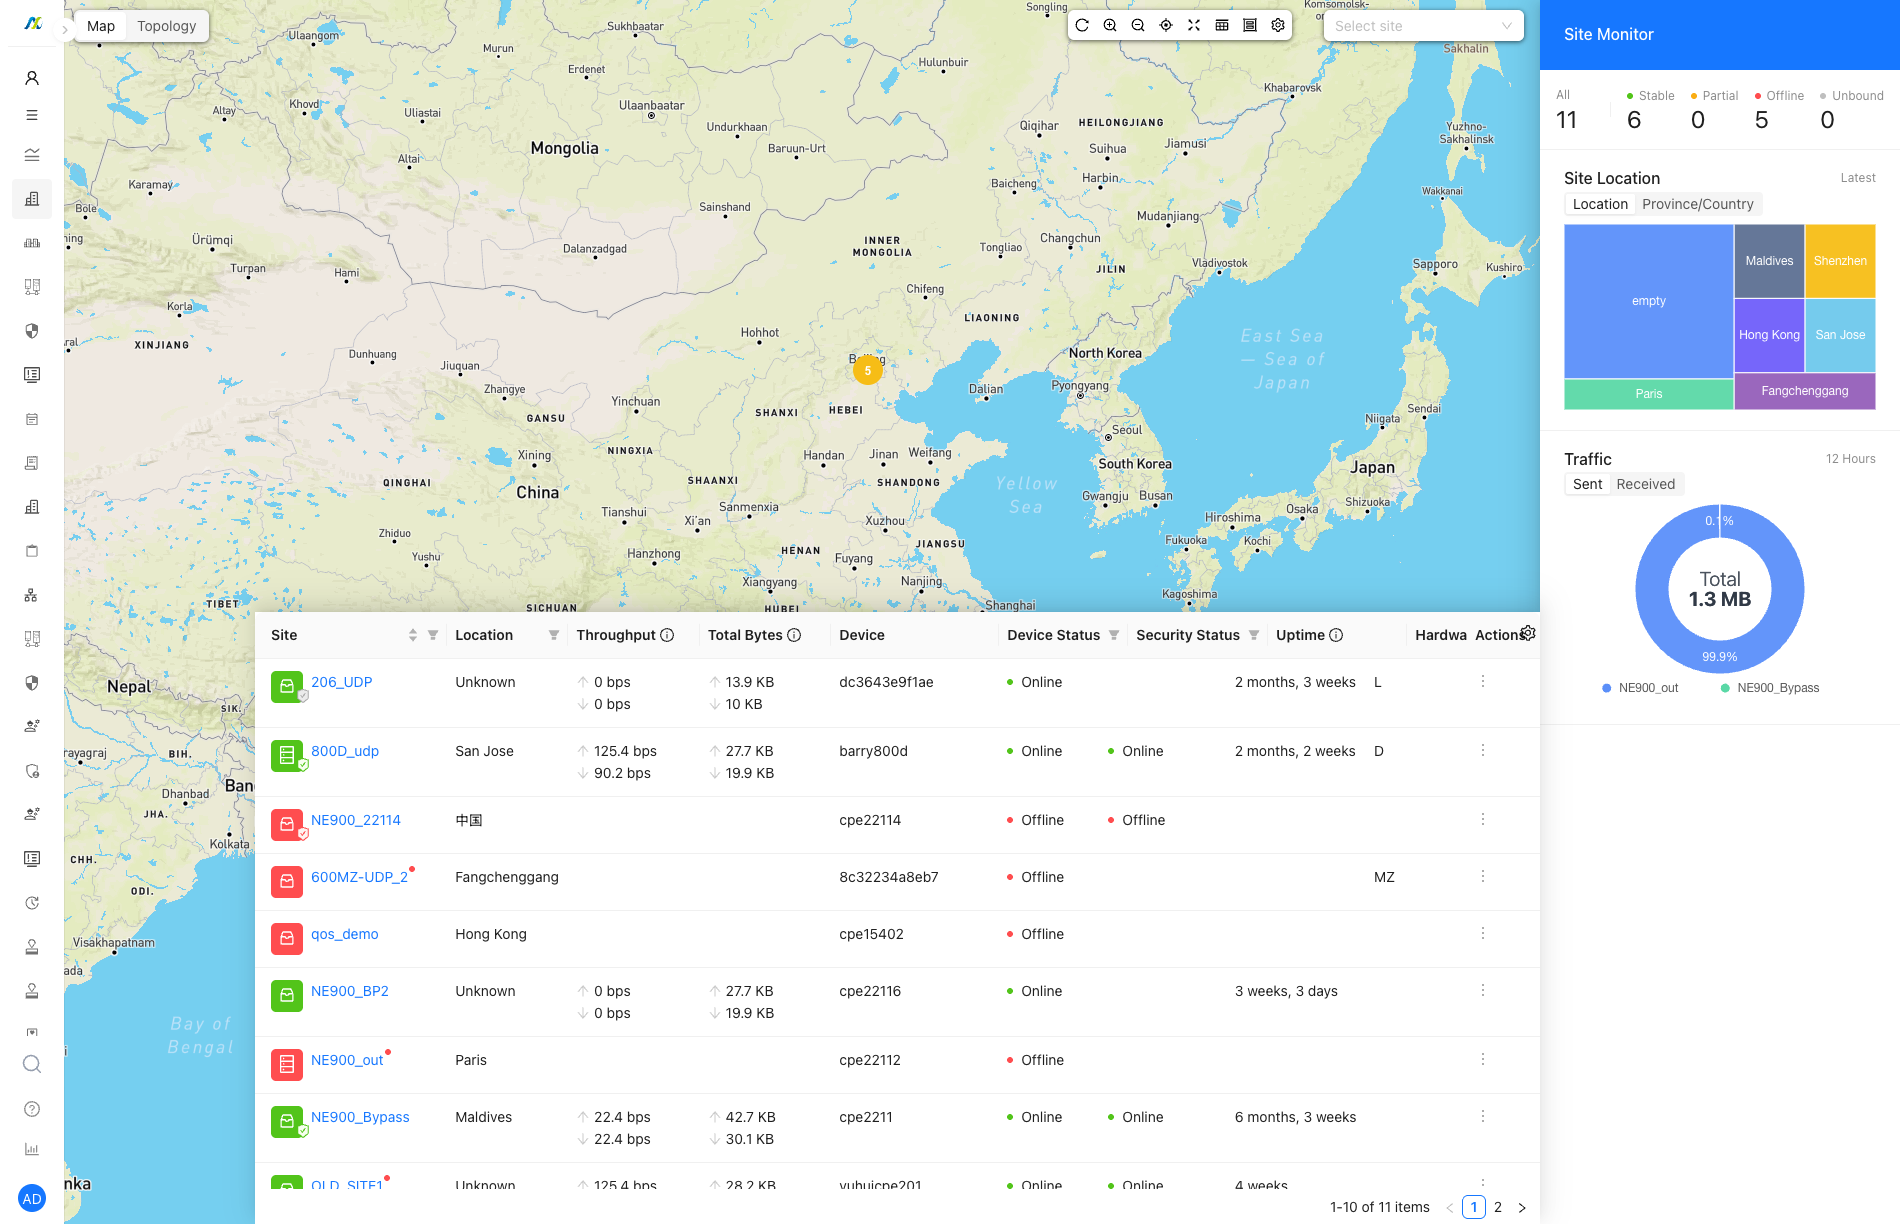
Site Information
Tenant > Monitor > Sites
After large-scale site mode is enabled, sites are displayed only in list view, without map or topology views.
Site Detail
System
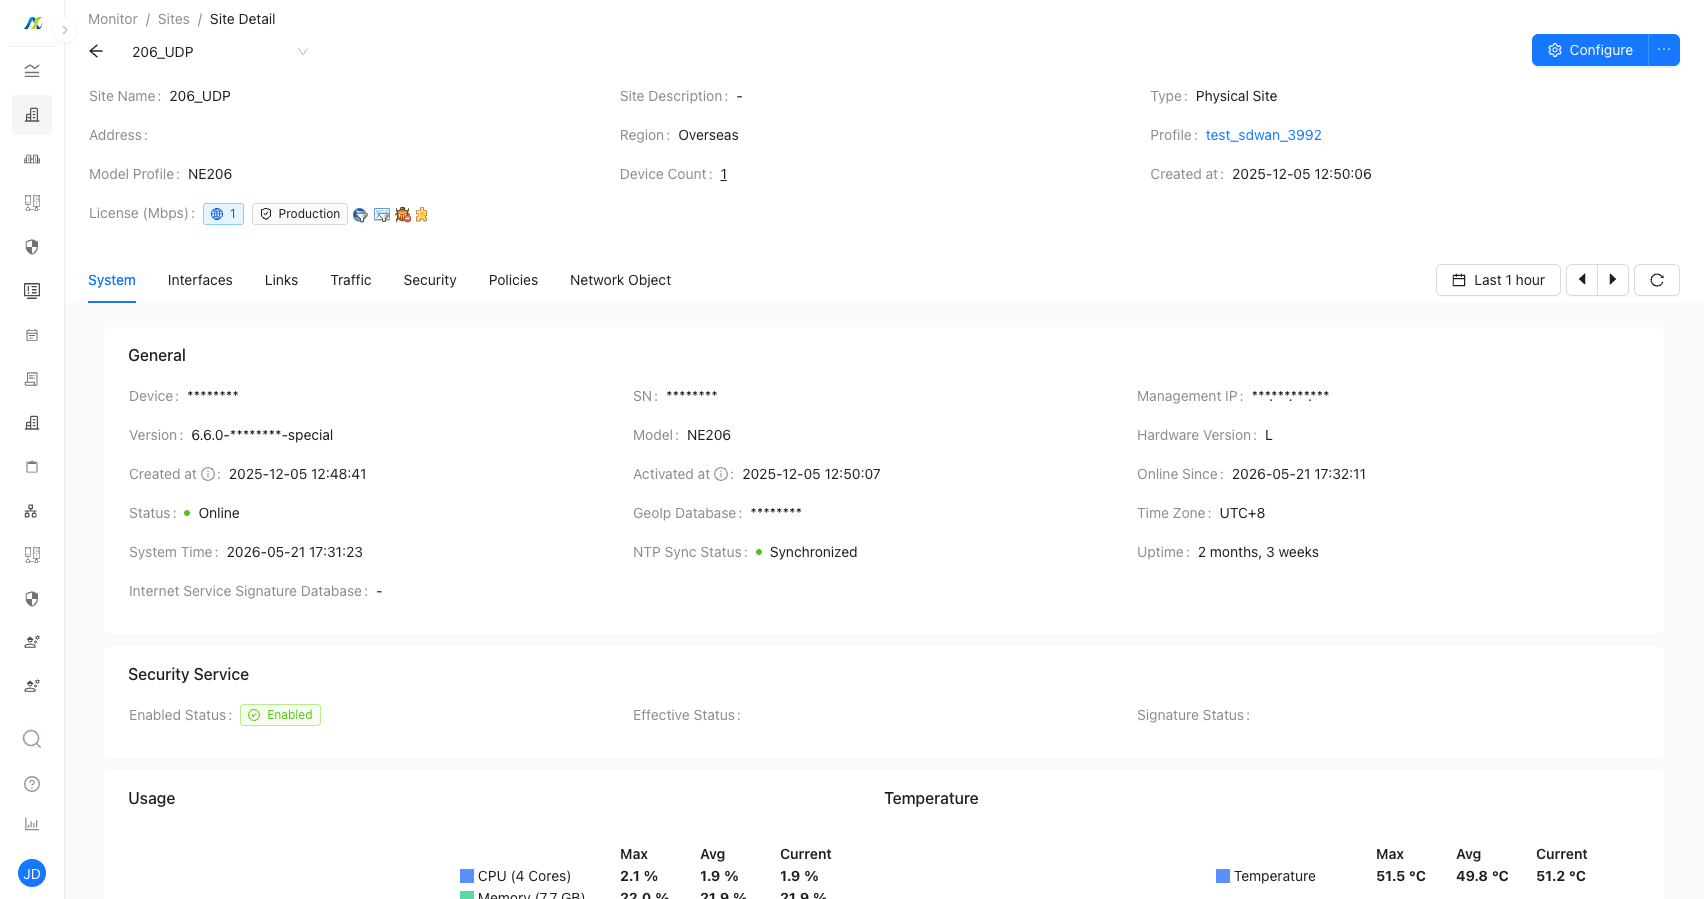
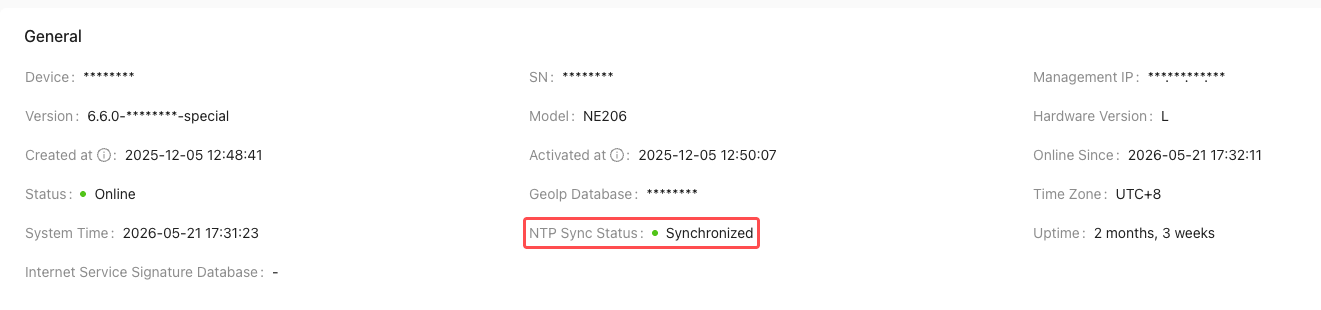
NTP Sync Status
- Shows whether the device NTP service is healthy.
- When the NTP service is running and NTP synchronization is normal, the status is displayed as normal.
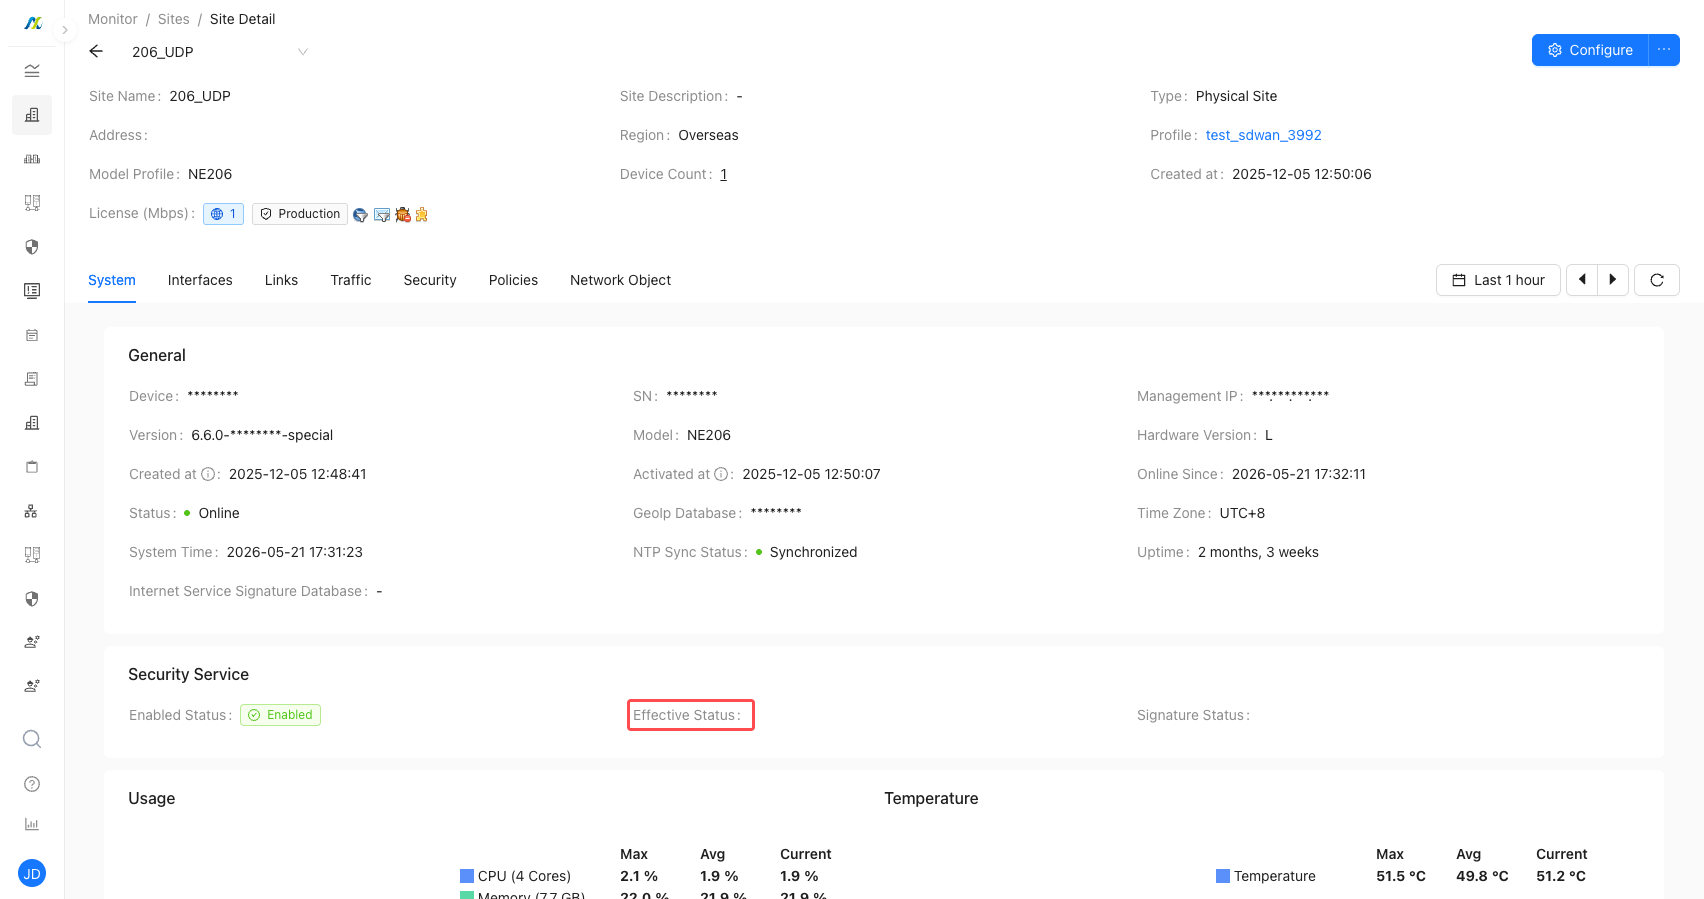
Security Service Information
- "Security Service Information" field descriptions:
- Enabled Status: possible values are Disabled, Enabled, and Not Supported (the hardware does not support security services).
- Effective Status: indicates whether the security service is effective. Possible values are Effective, Abnormal, and Partial (multiple VRFs exist, and some VRFs are abnormal).
- Signature Status: indicates whether the security signature database is up to date. Possible values are Latest, Upgradeable, and Partial (multiple VRFs exist, and some VRFs can be upgraded).
Click "Effective Status" to go to "License Management" and view detailed Security Service information.
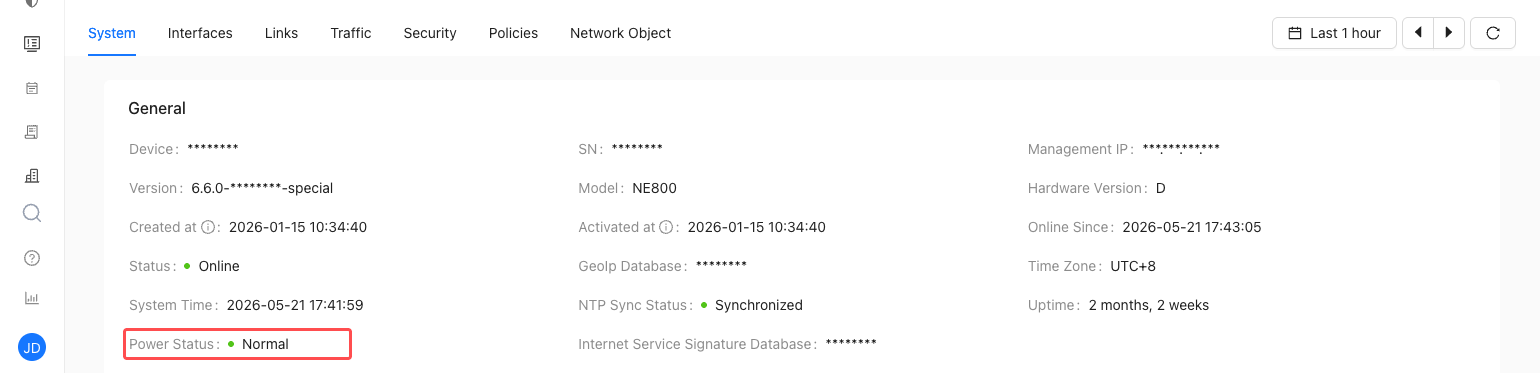
Power Status
- For devices with dual power supplies, such as NE600 and NE800, O&M personnel can view the current power status.
- If one power supply is abnormal, the status is displayed as abnormal.
- After recovery, the status is displayed as normal.
- Power status is not displayed after the device goes offline.
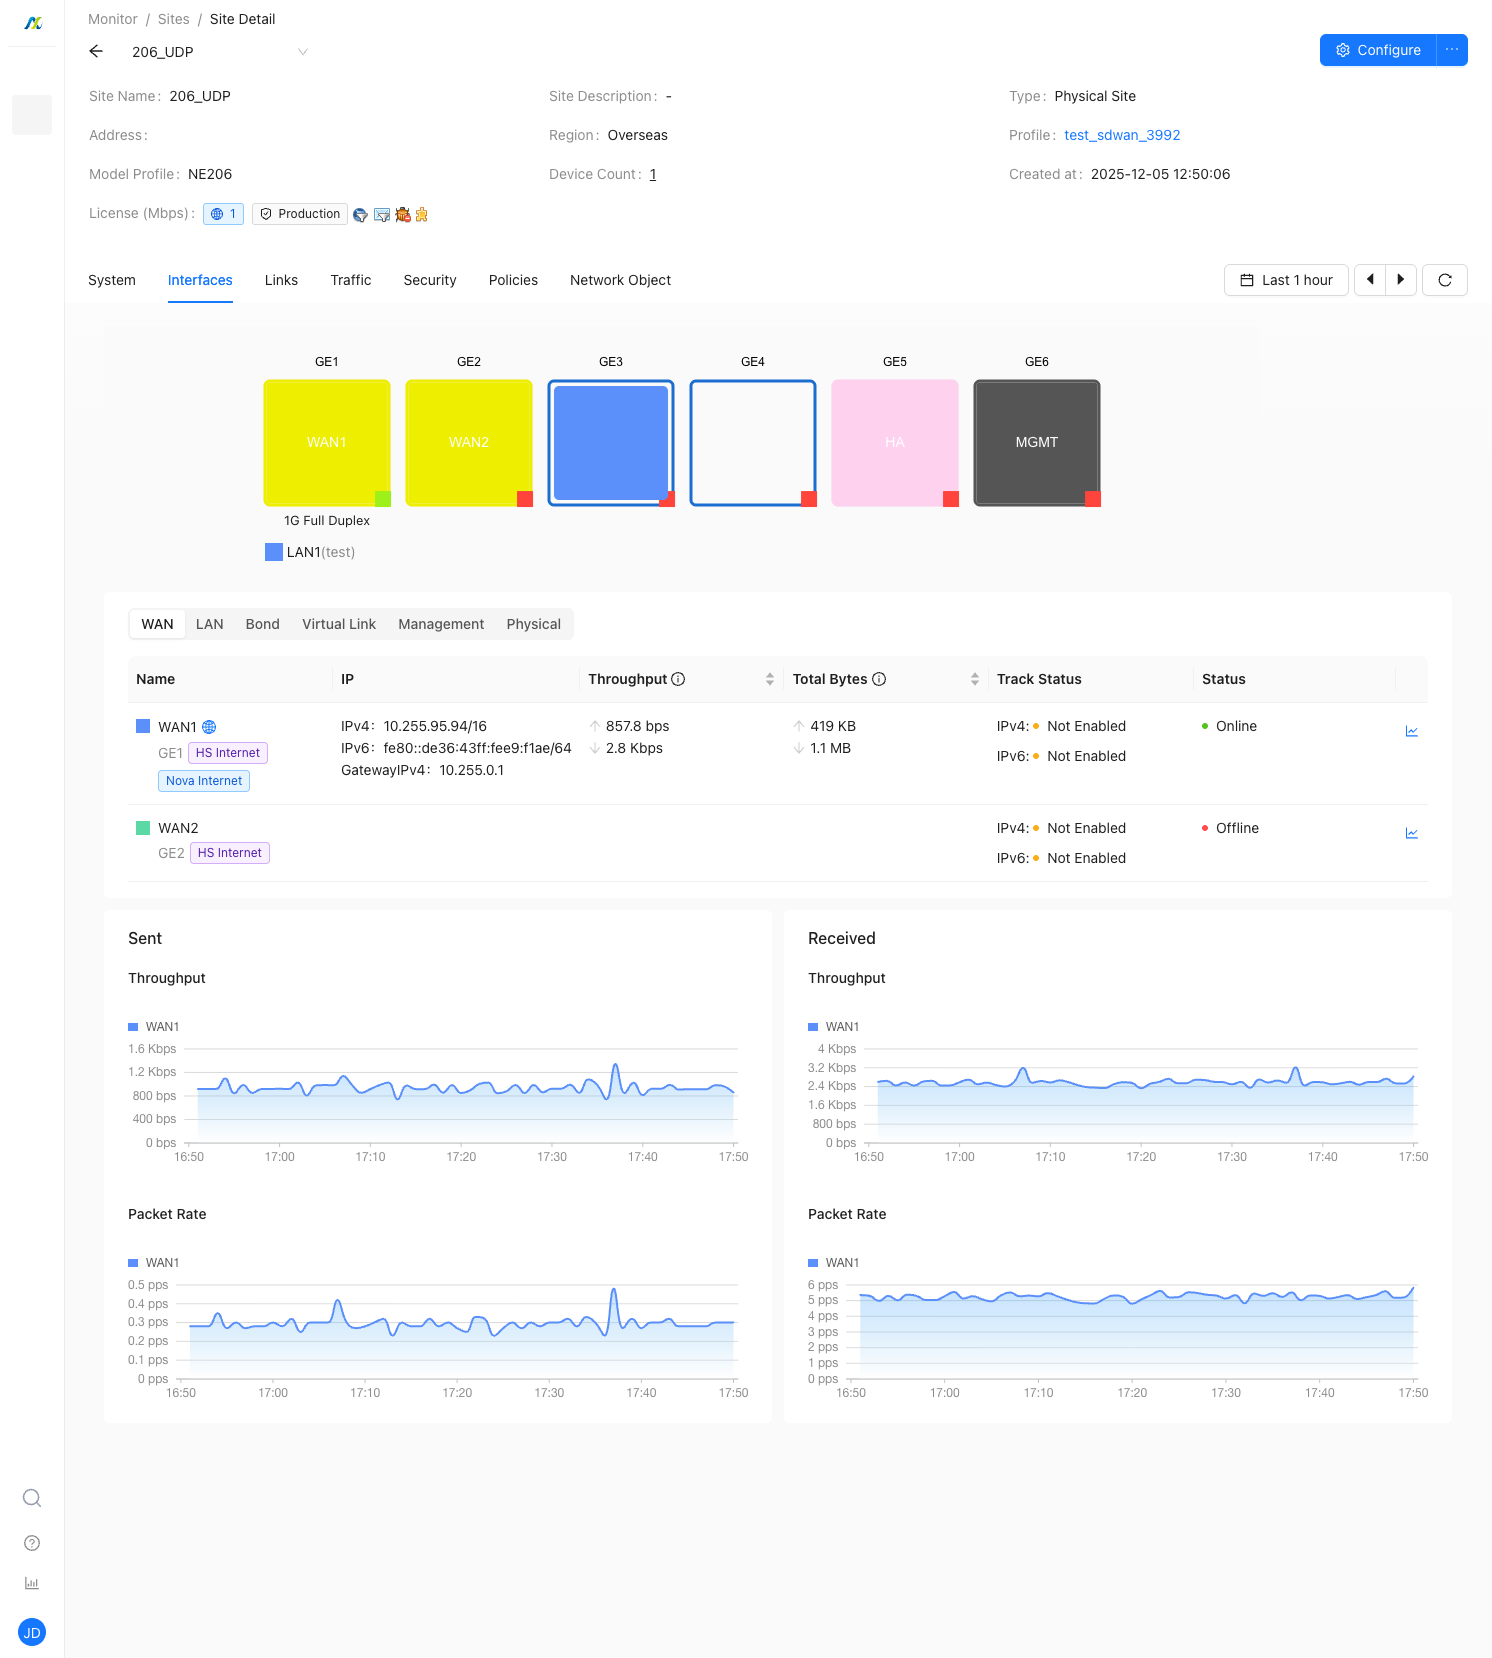
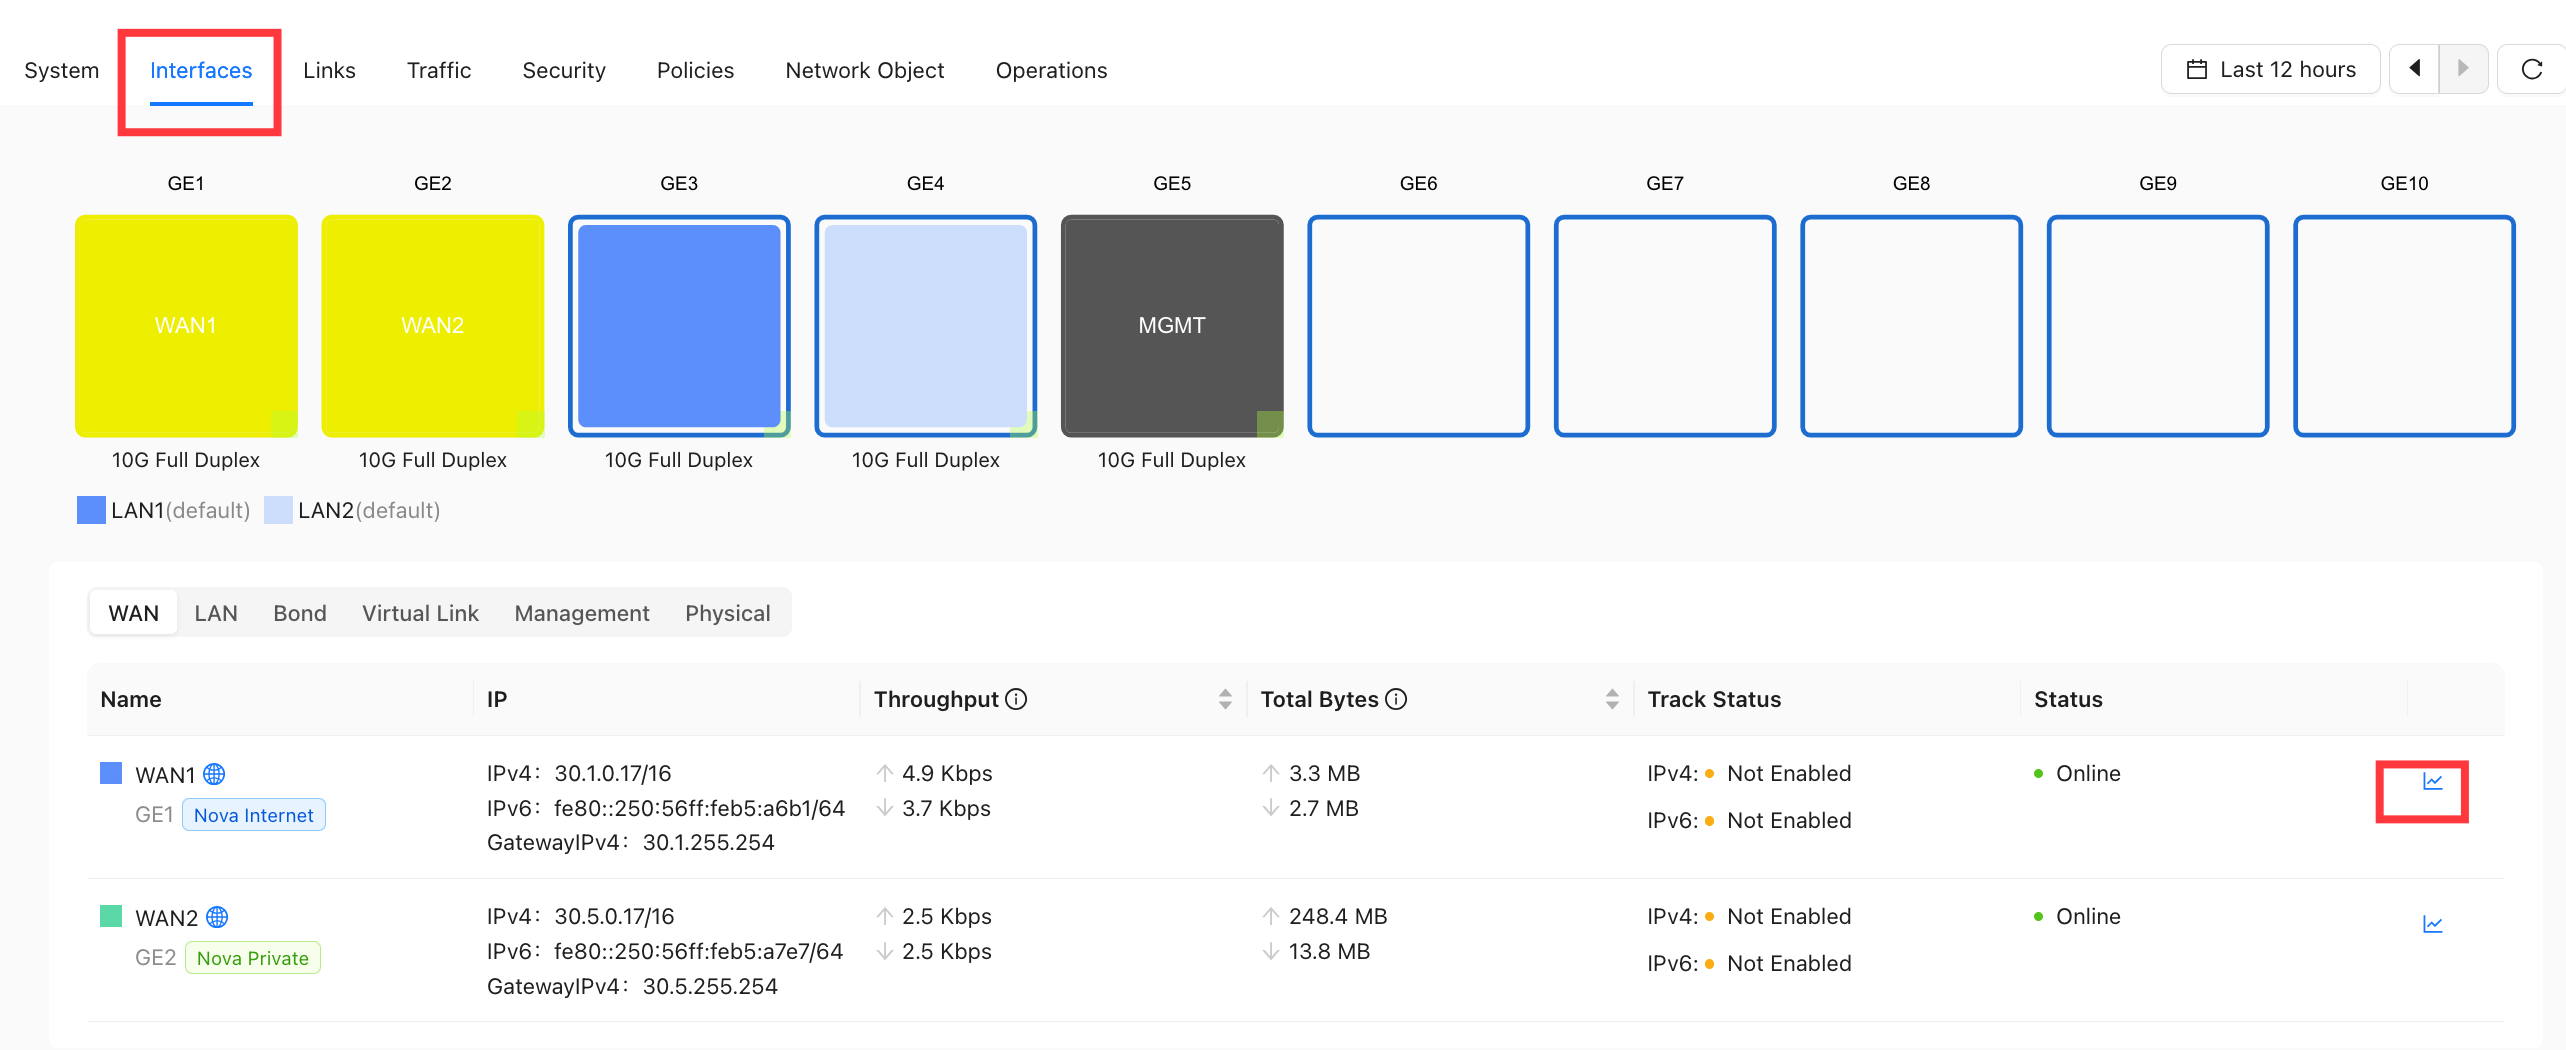
Interfaces
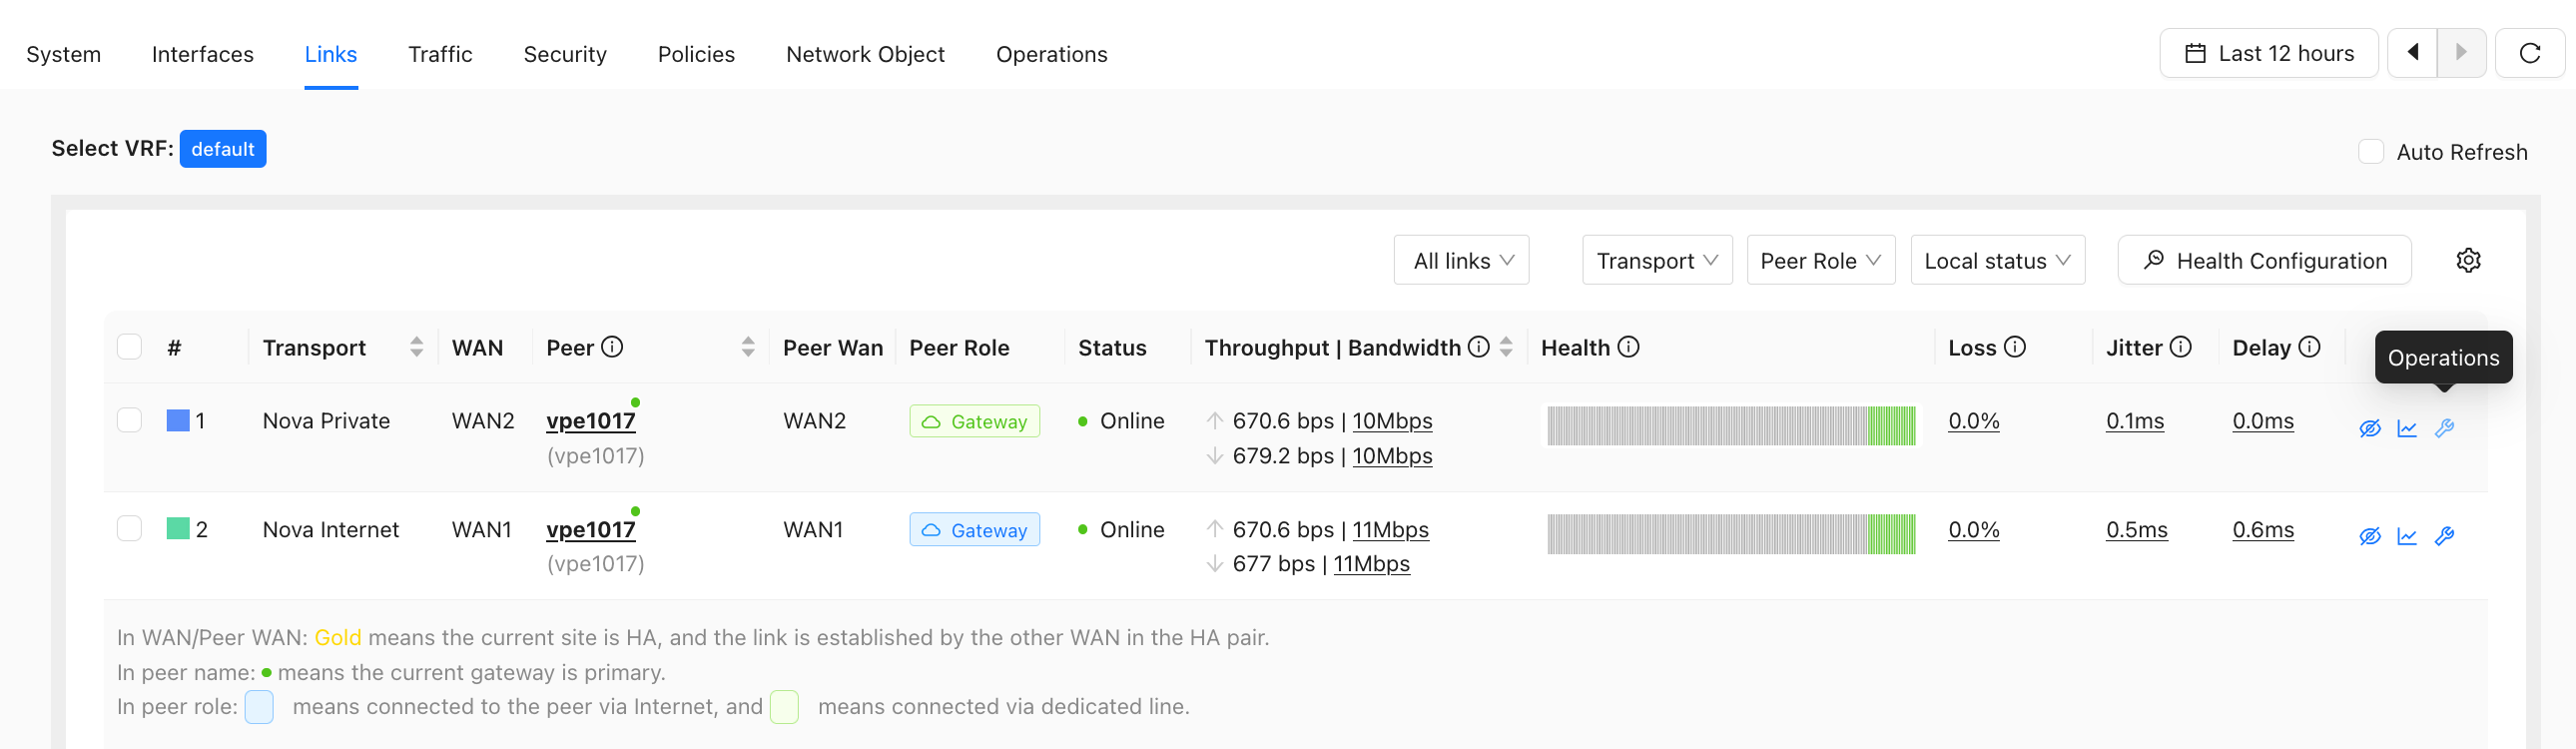
Links
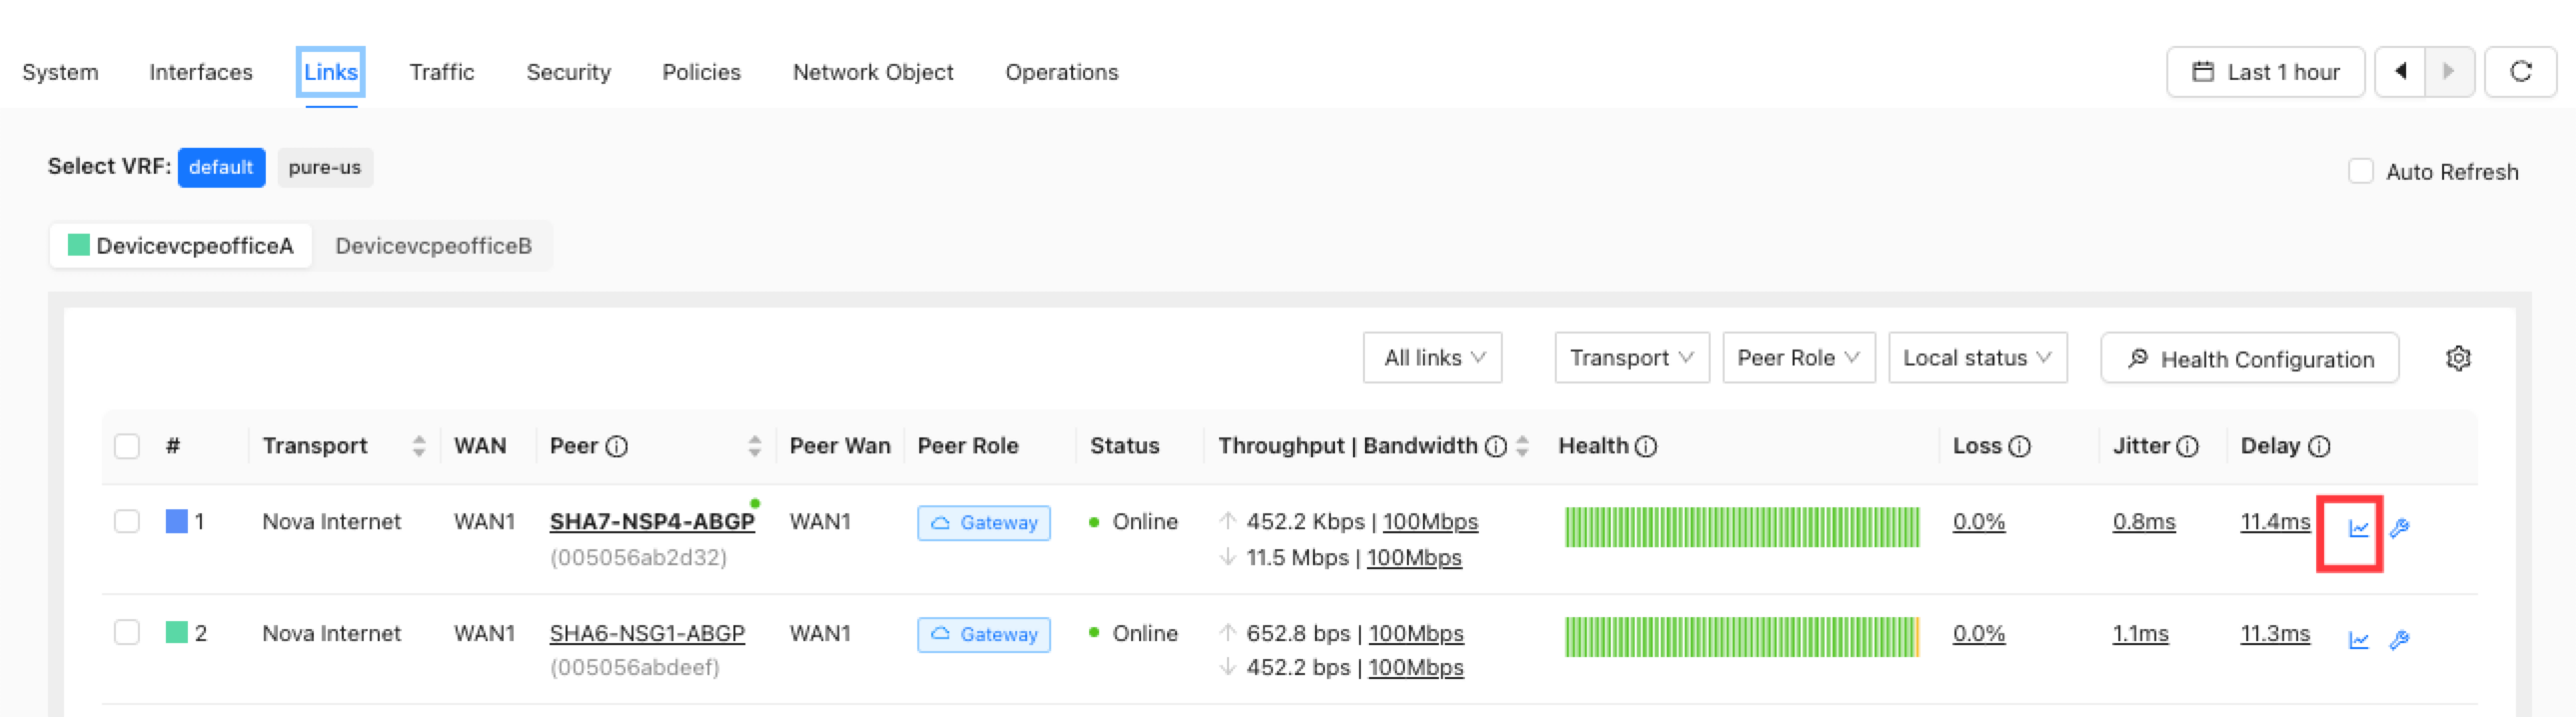
The following items describe the key metrics in link monitoring:
- Peer: usually a Nova Gateway or another site.
- Throughput: the real-time rate during the current 1-minute interval.
- Bandwidth: determined by the transport network bandwidth, WAN interface bandwidth, and licensed bandwidth.
- If multiple bandwidth limits apply, the effective bandwidth is calculated as follows:
- For Nova Internet or a Nova private line, uplink bandwidth is the minimum of the transport network bandwidth, WAN interface bandwidth, and licensed bandwidth. Downlink bandwidth is the minimum of the transport network bandwidth and licensed bandwidth.
- For Hub-Spoke Internet or a Hub-Spoke private line, uplink bandwidth is also the minimum of the transport network bandwidth, WAN interface bandwidth, and licensed bandwidth. Downlink bandwidth depends on the peer configuration.
- If the license includes both Nova Internet and Nova private line bandwidth, Nova Internet can share the Nova private line bandwidth.
- Health: calculated from link latency, packet loss, and jitter.
- Green: latency, packet loss, and jitter are all good.
- Orange: at least one of latency, packet loss, or jitter is fair, and none is poor.
- Red: at least one of latency, packet loss, or jitter is poor.
- Gray: latency, packet loss, and jitter data is unavailable.
- Evaluation thresholds:
- Latency (ms): Good [0 ~ 50], Fair (50 ~ 80], Poor (>80).
- Packet loss (%): Good [0 ~ 1], Fair (1 ~ 3], Poor (>3).
- Jitter (ms): Good [0 ~ 7], Fair (7 ~ 30], Poor (>30).
- Packet loss rate: the average value over the last 5 minutes.
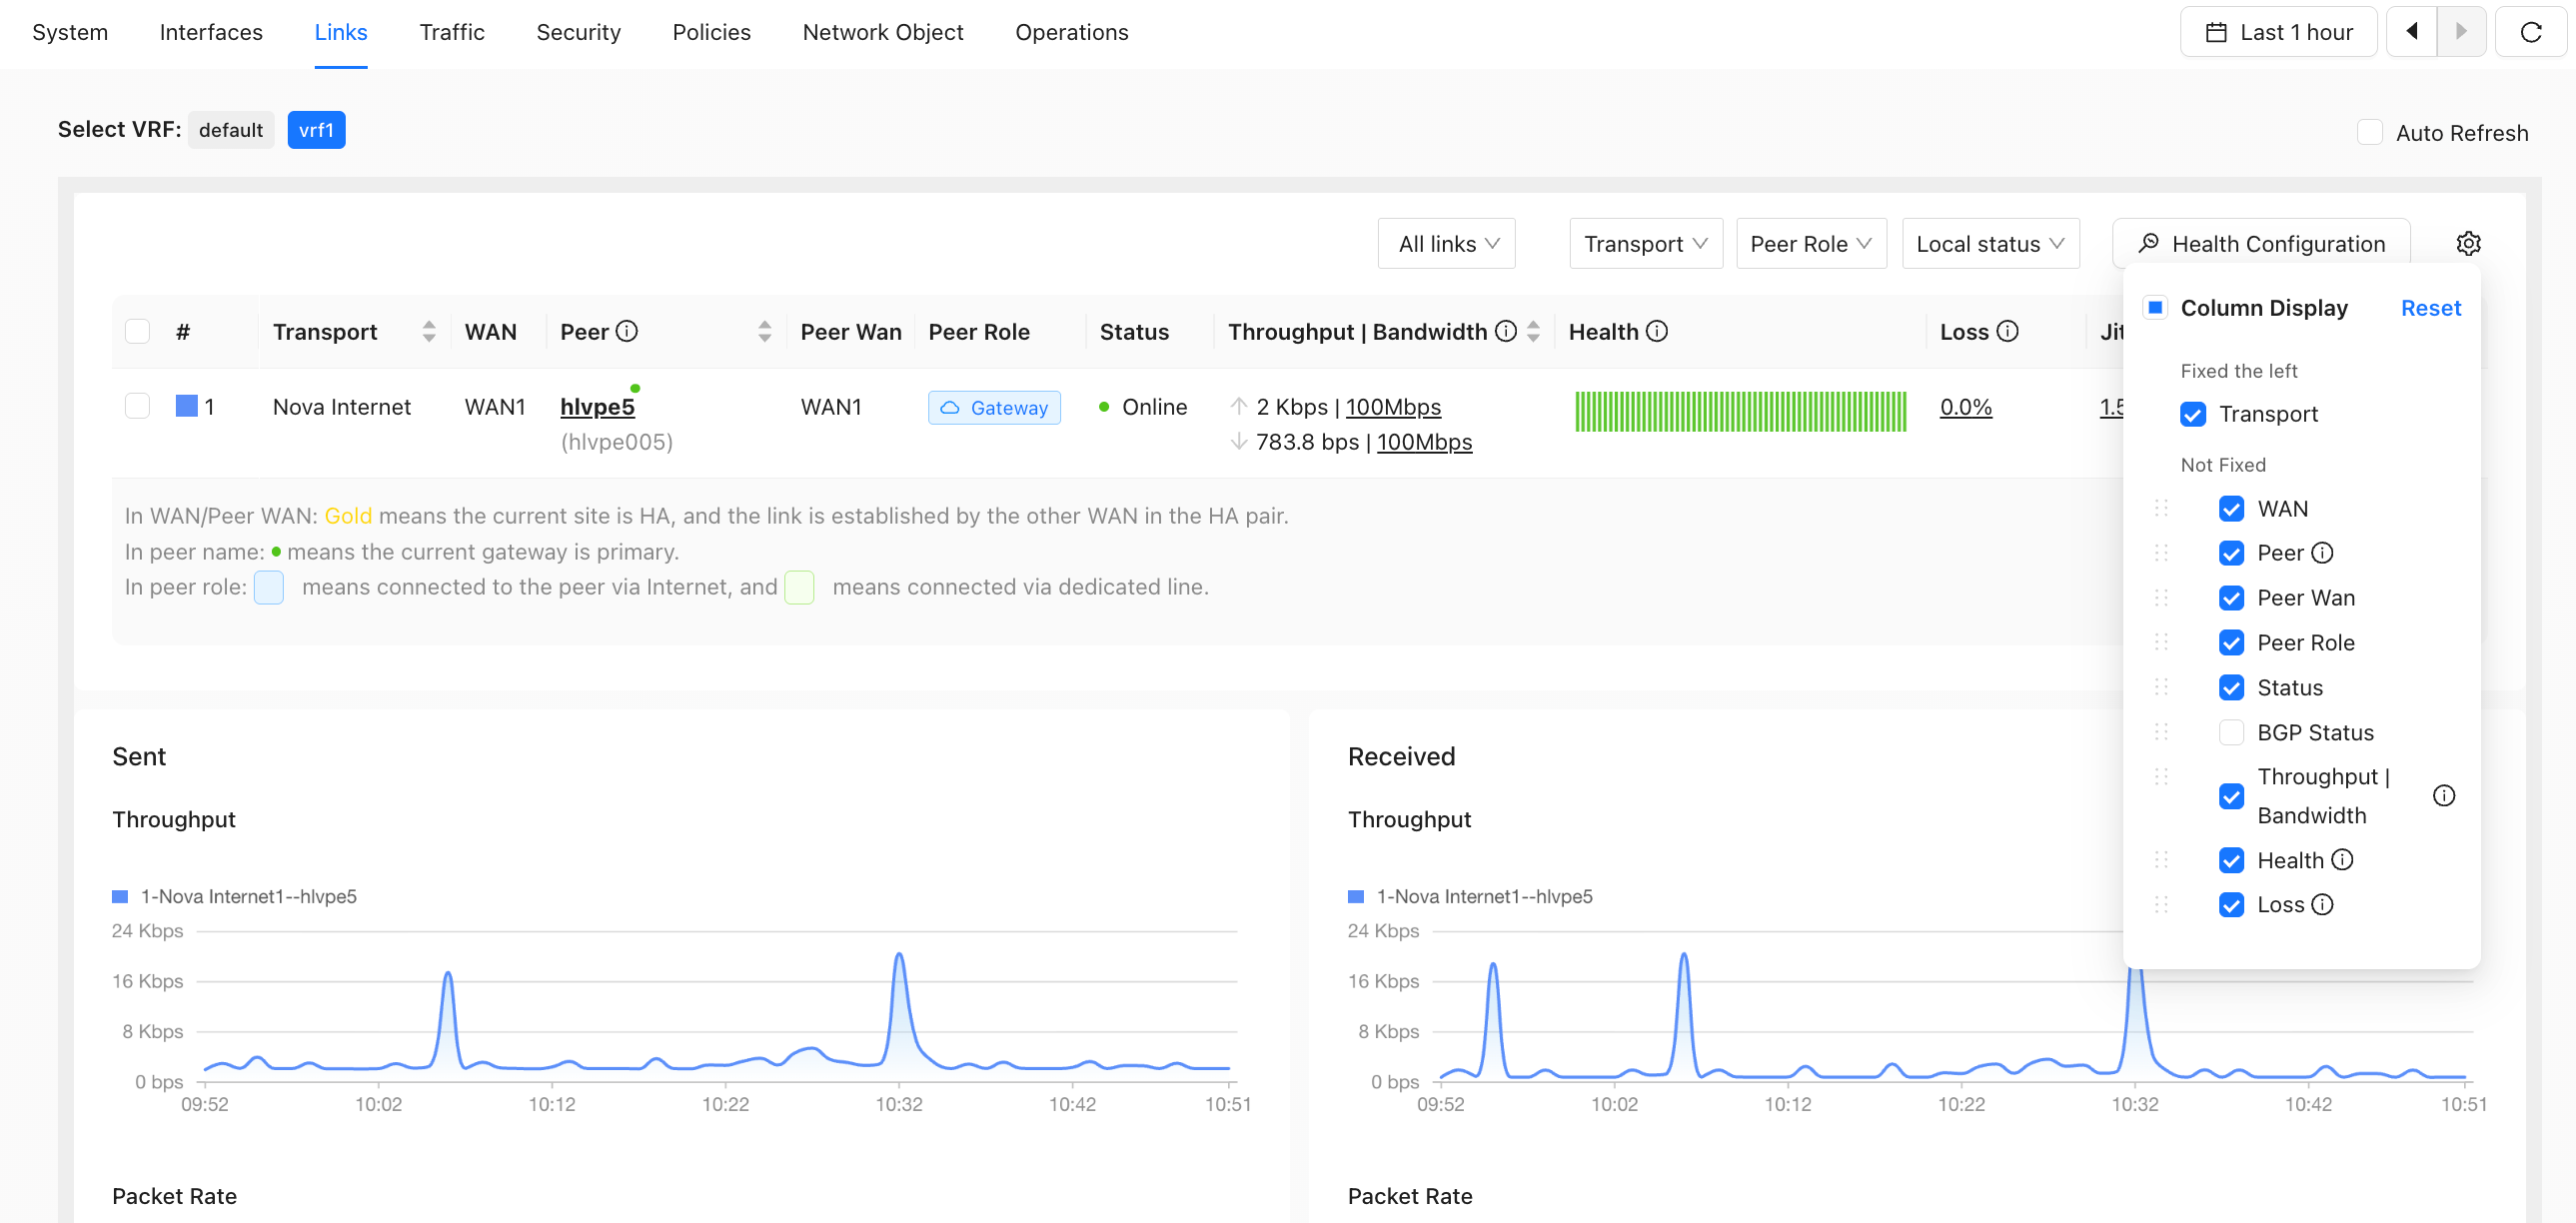
The following columns are available in link monitoring:
- WAN
- Peer Name
- Peer WAN
- Status
- BGP Status (select this column to display it)
- Throughput | Bandwidth
- Sent and received bytes (select these columns to display them)
- Sent and received packets (select these columns to display them)
- Health
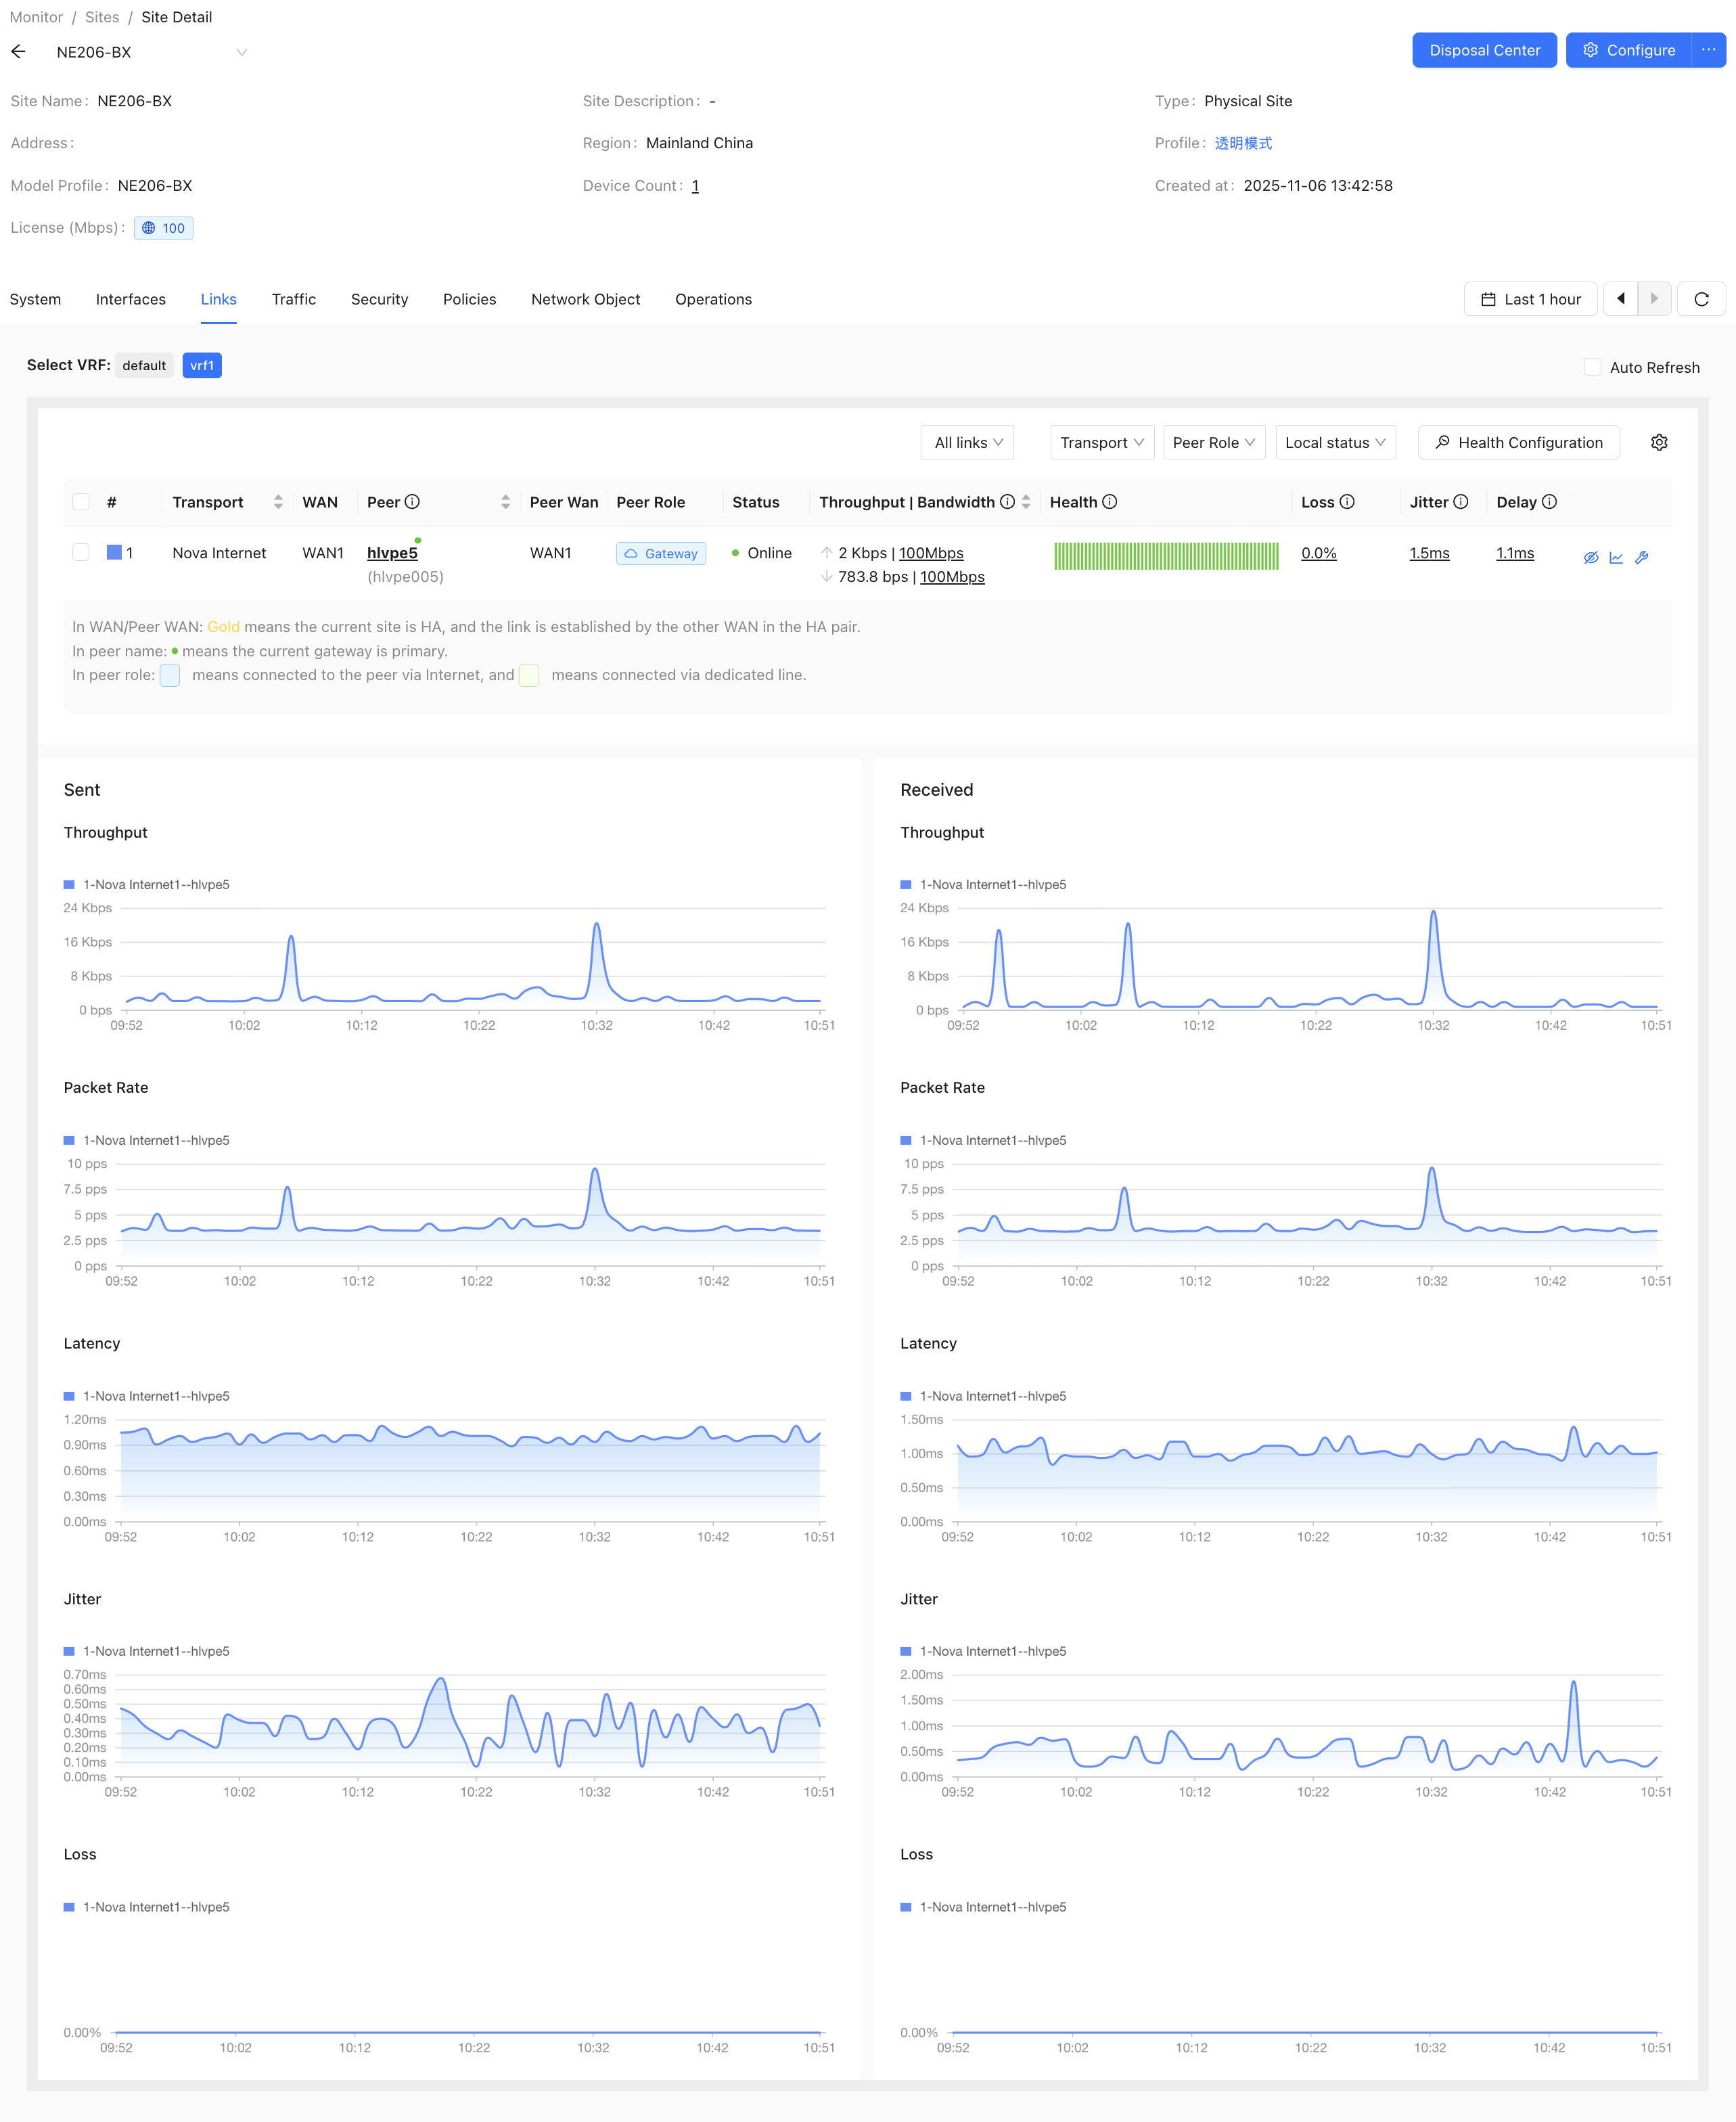
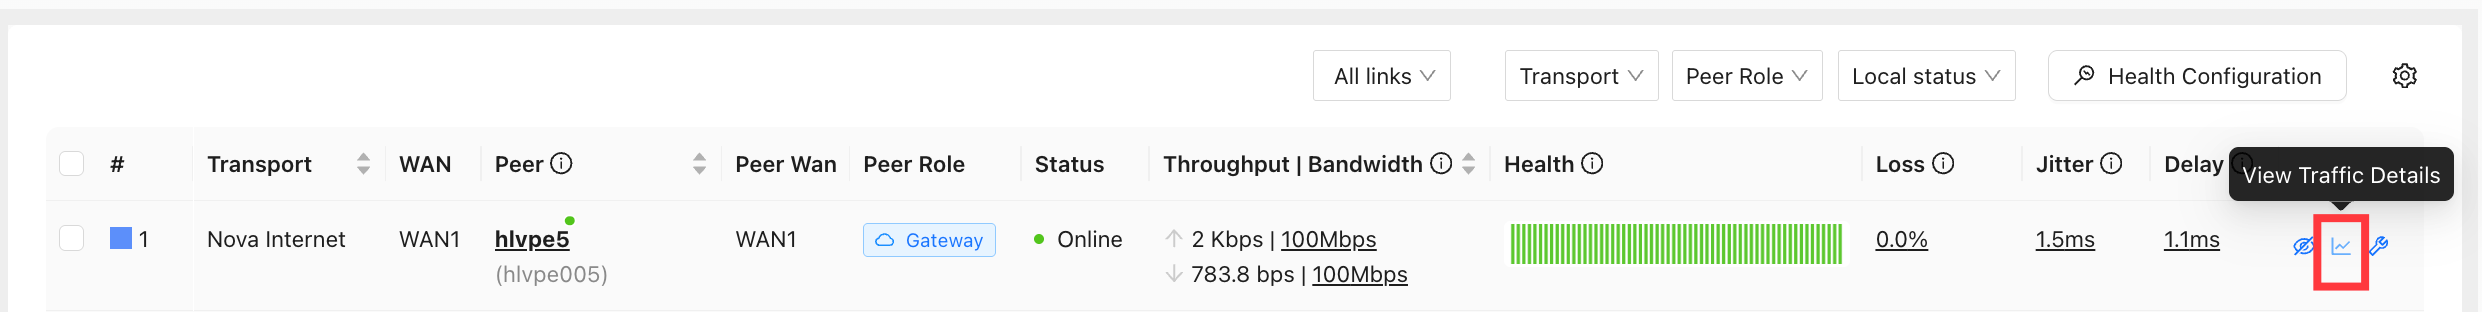
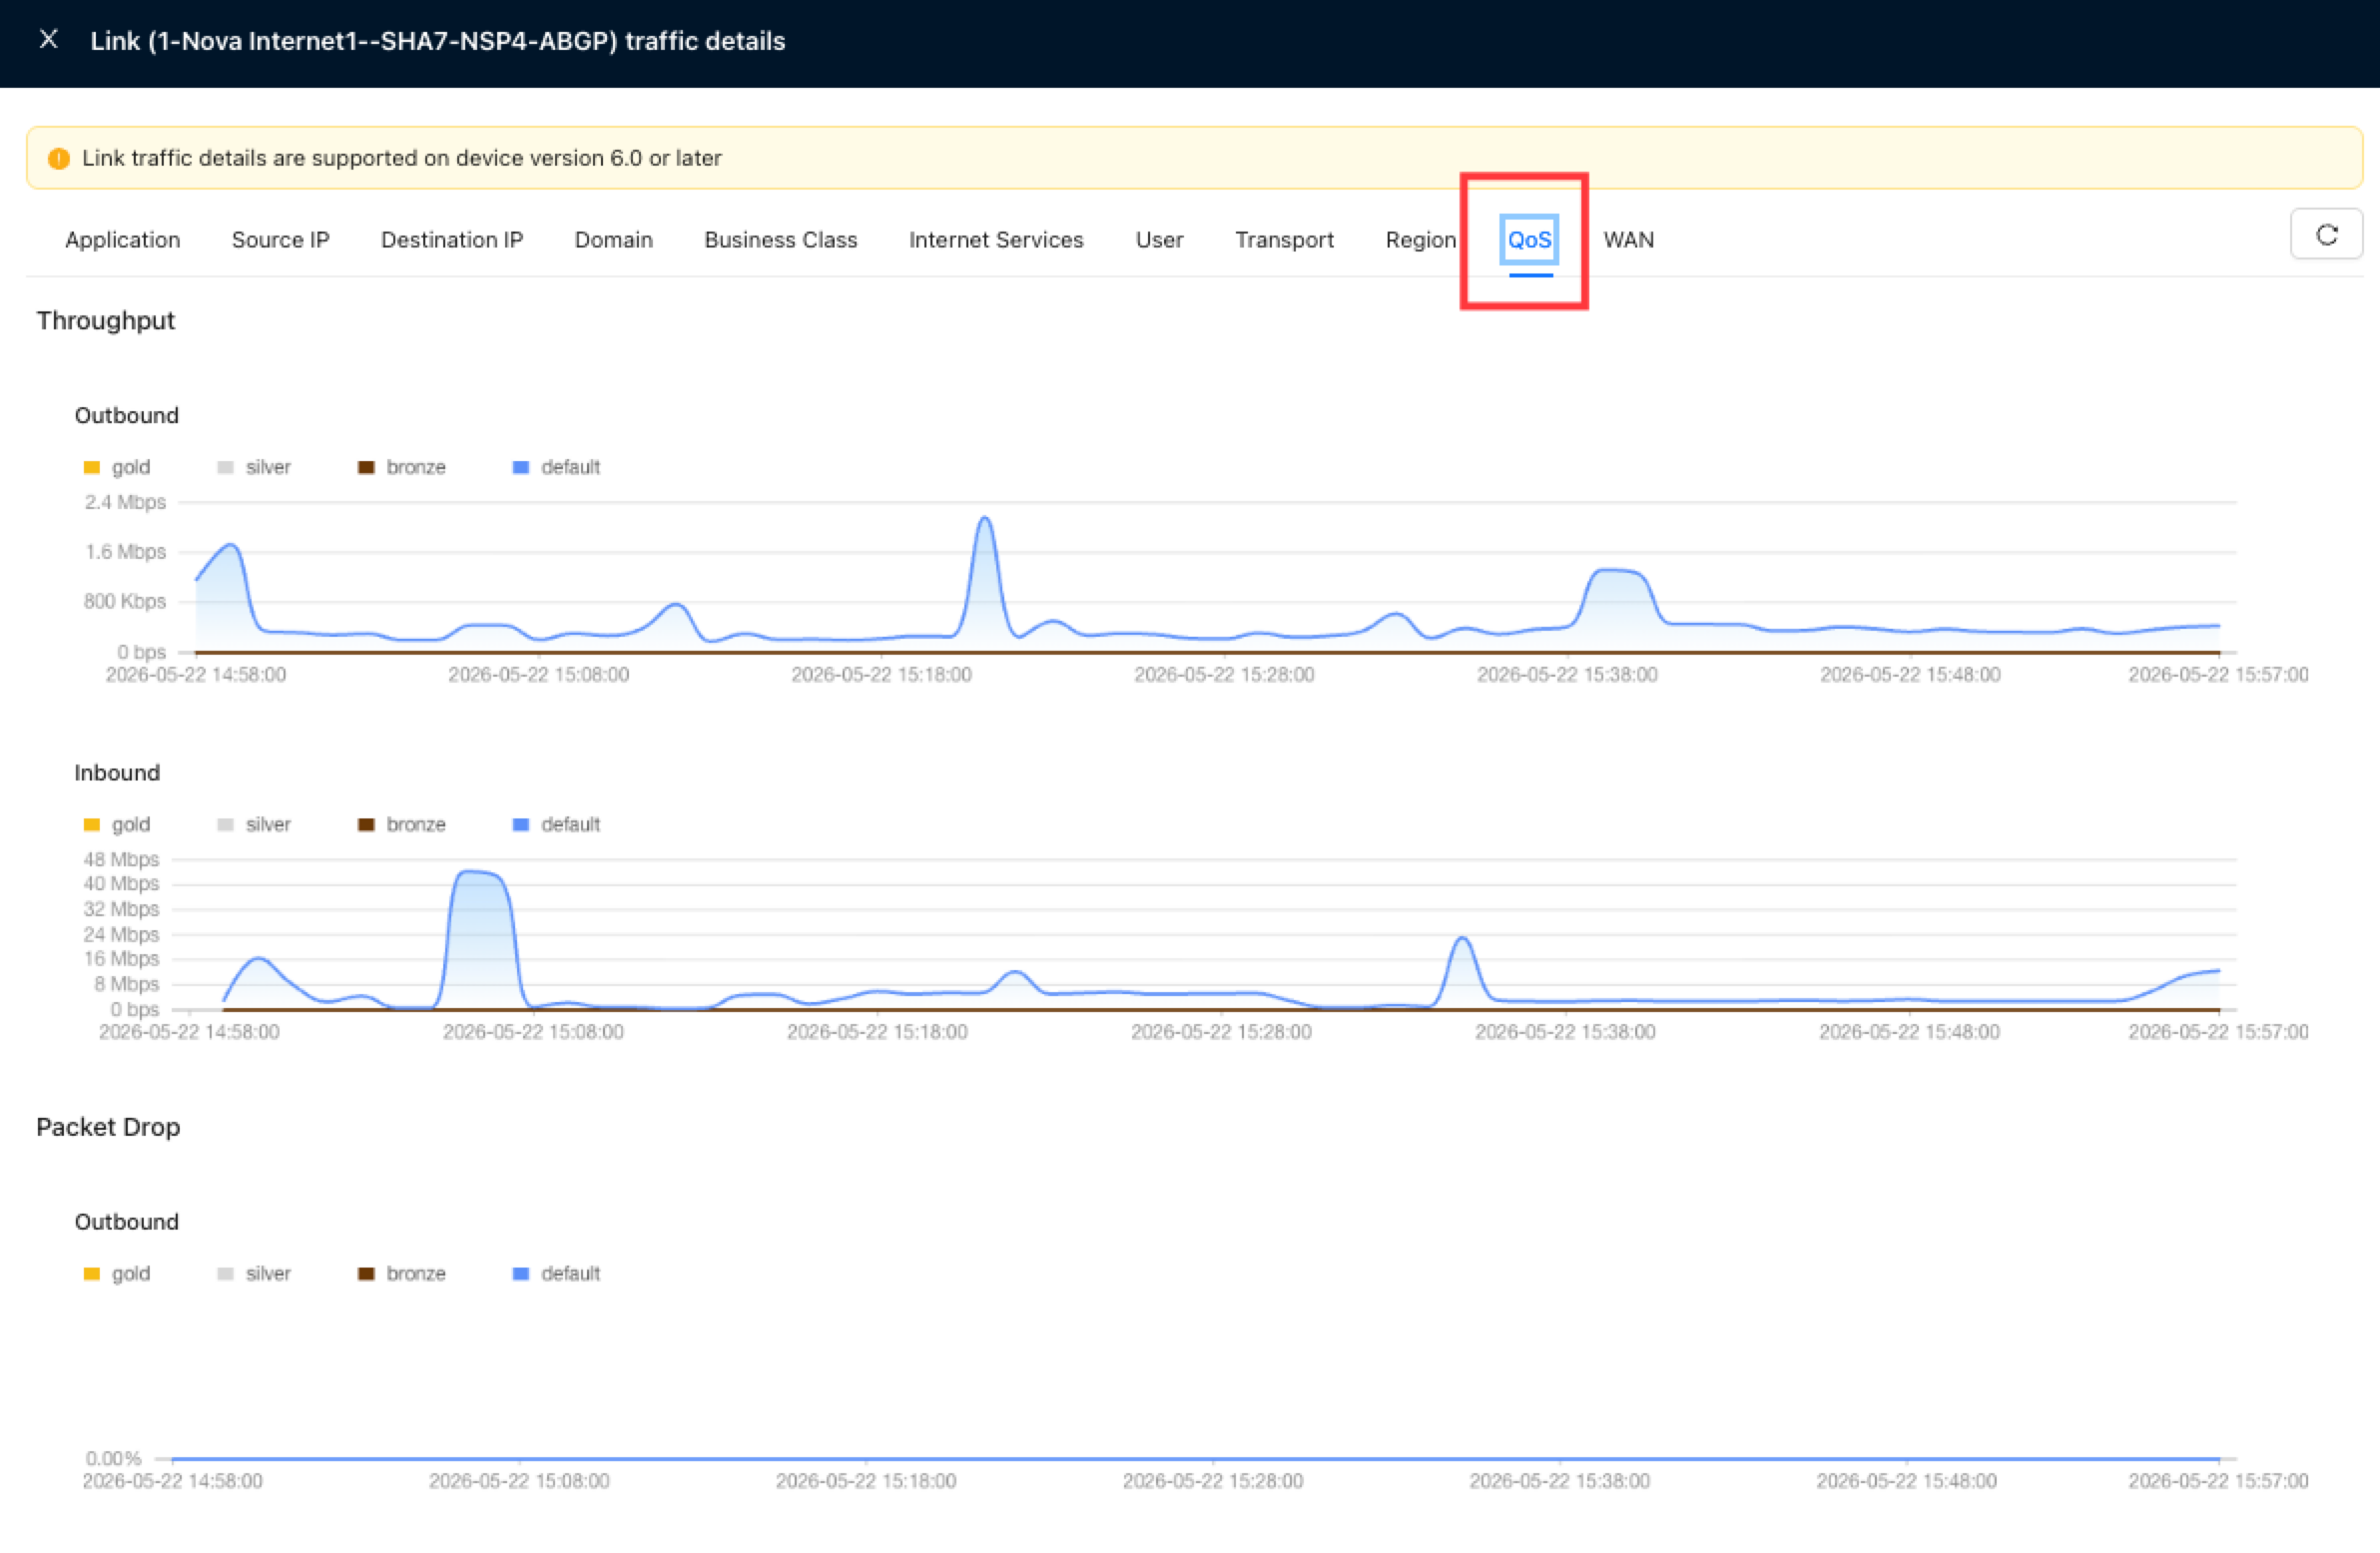
Link traffic details
- View traffic by application, application category, source host, destination domain, destination IP, business category, and transport network.
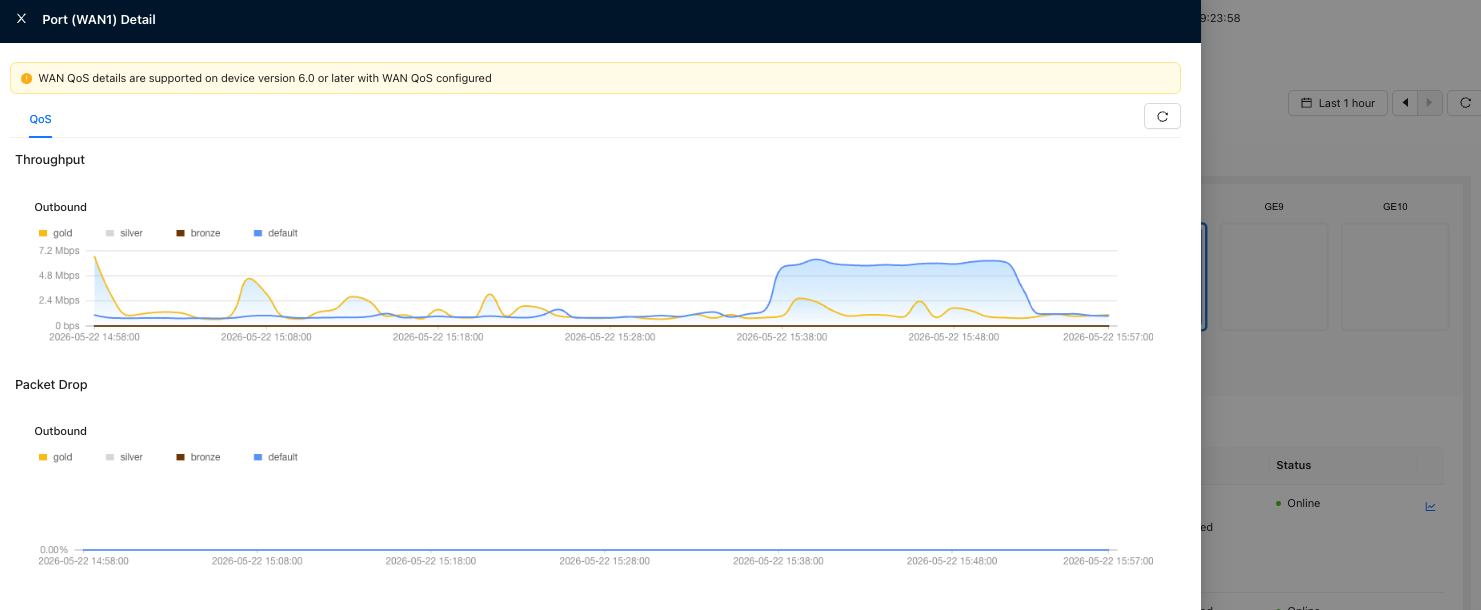
- View outbound and inbound QoS throughput.
- View outbound and inbound QoS packet loss.
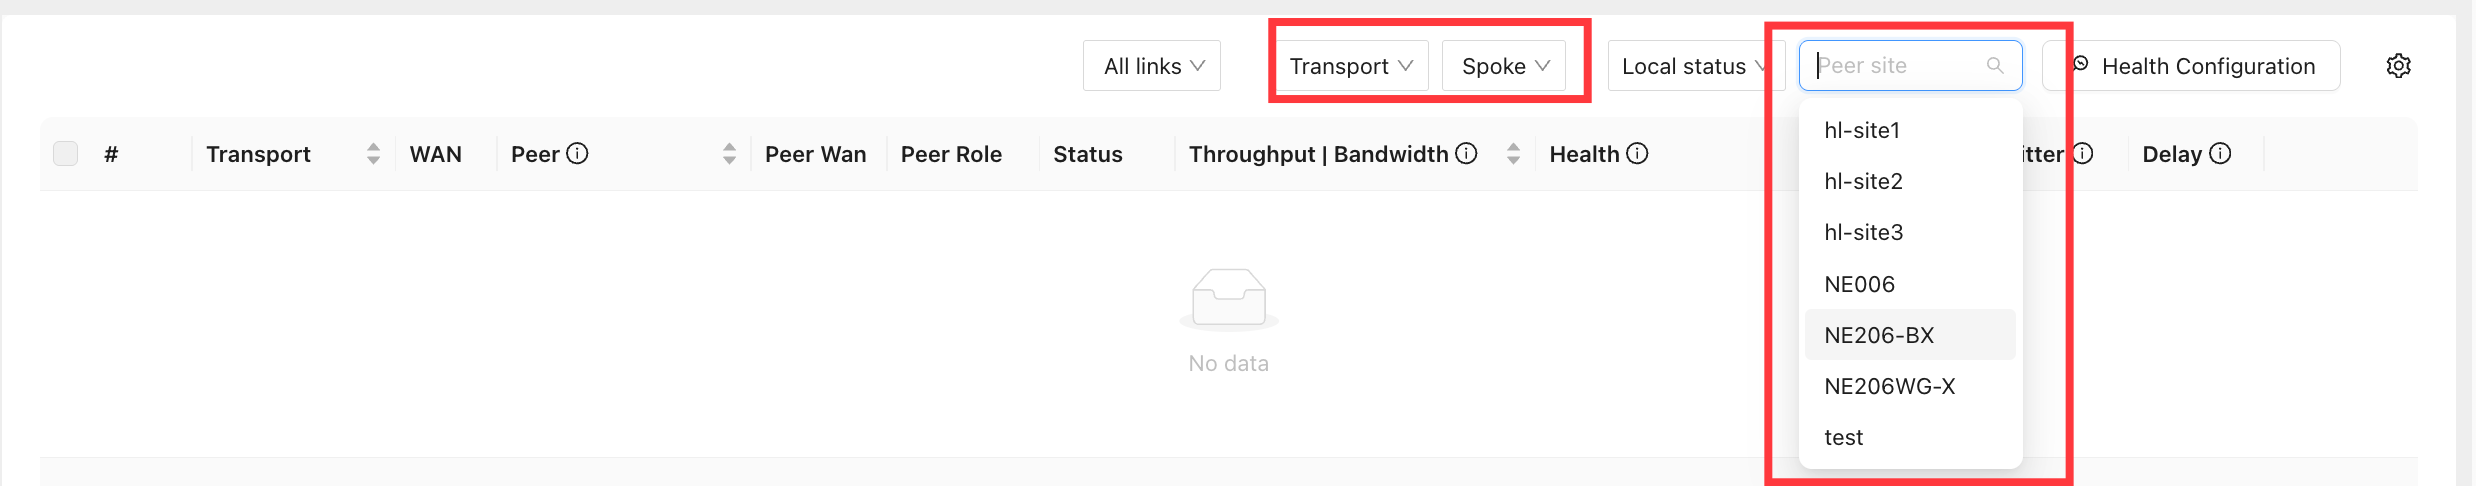
Select peer site
- When Peer Role is set to Spoke or Full-Mesh Branch, you can select a peer site to filter links.
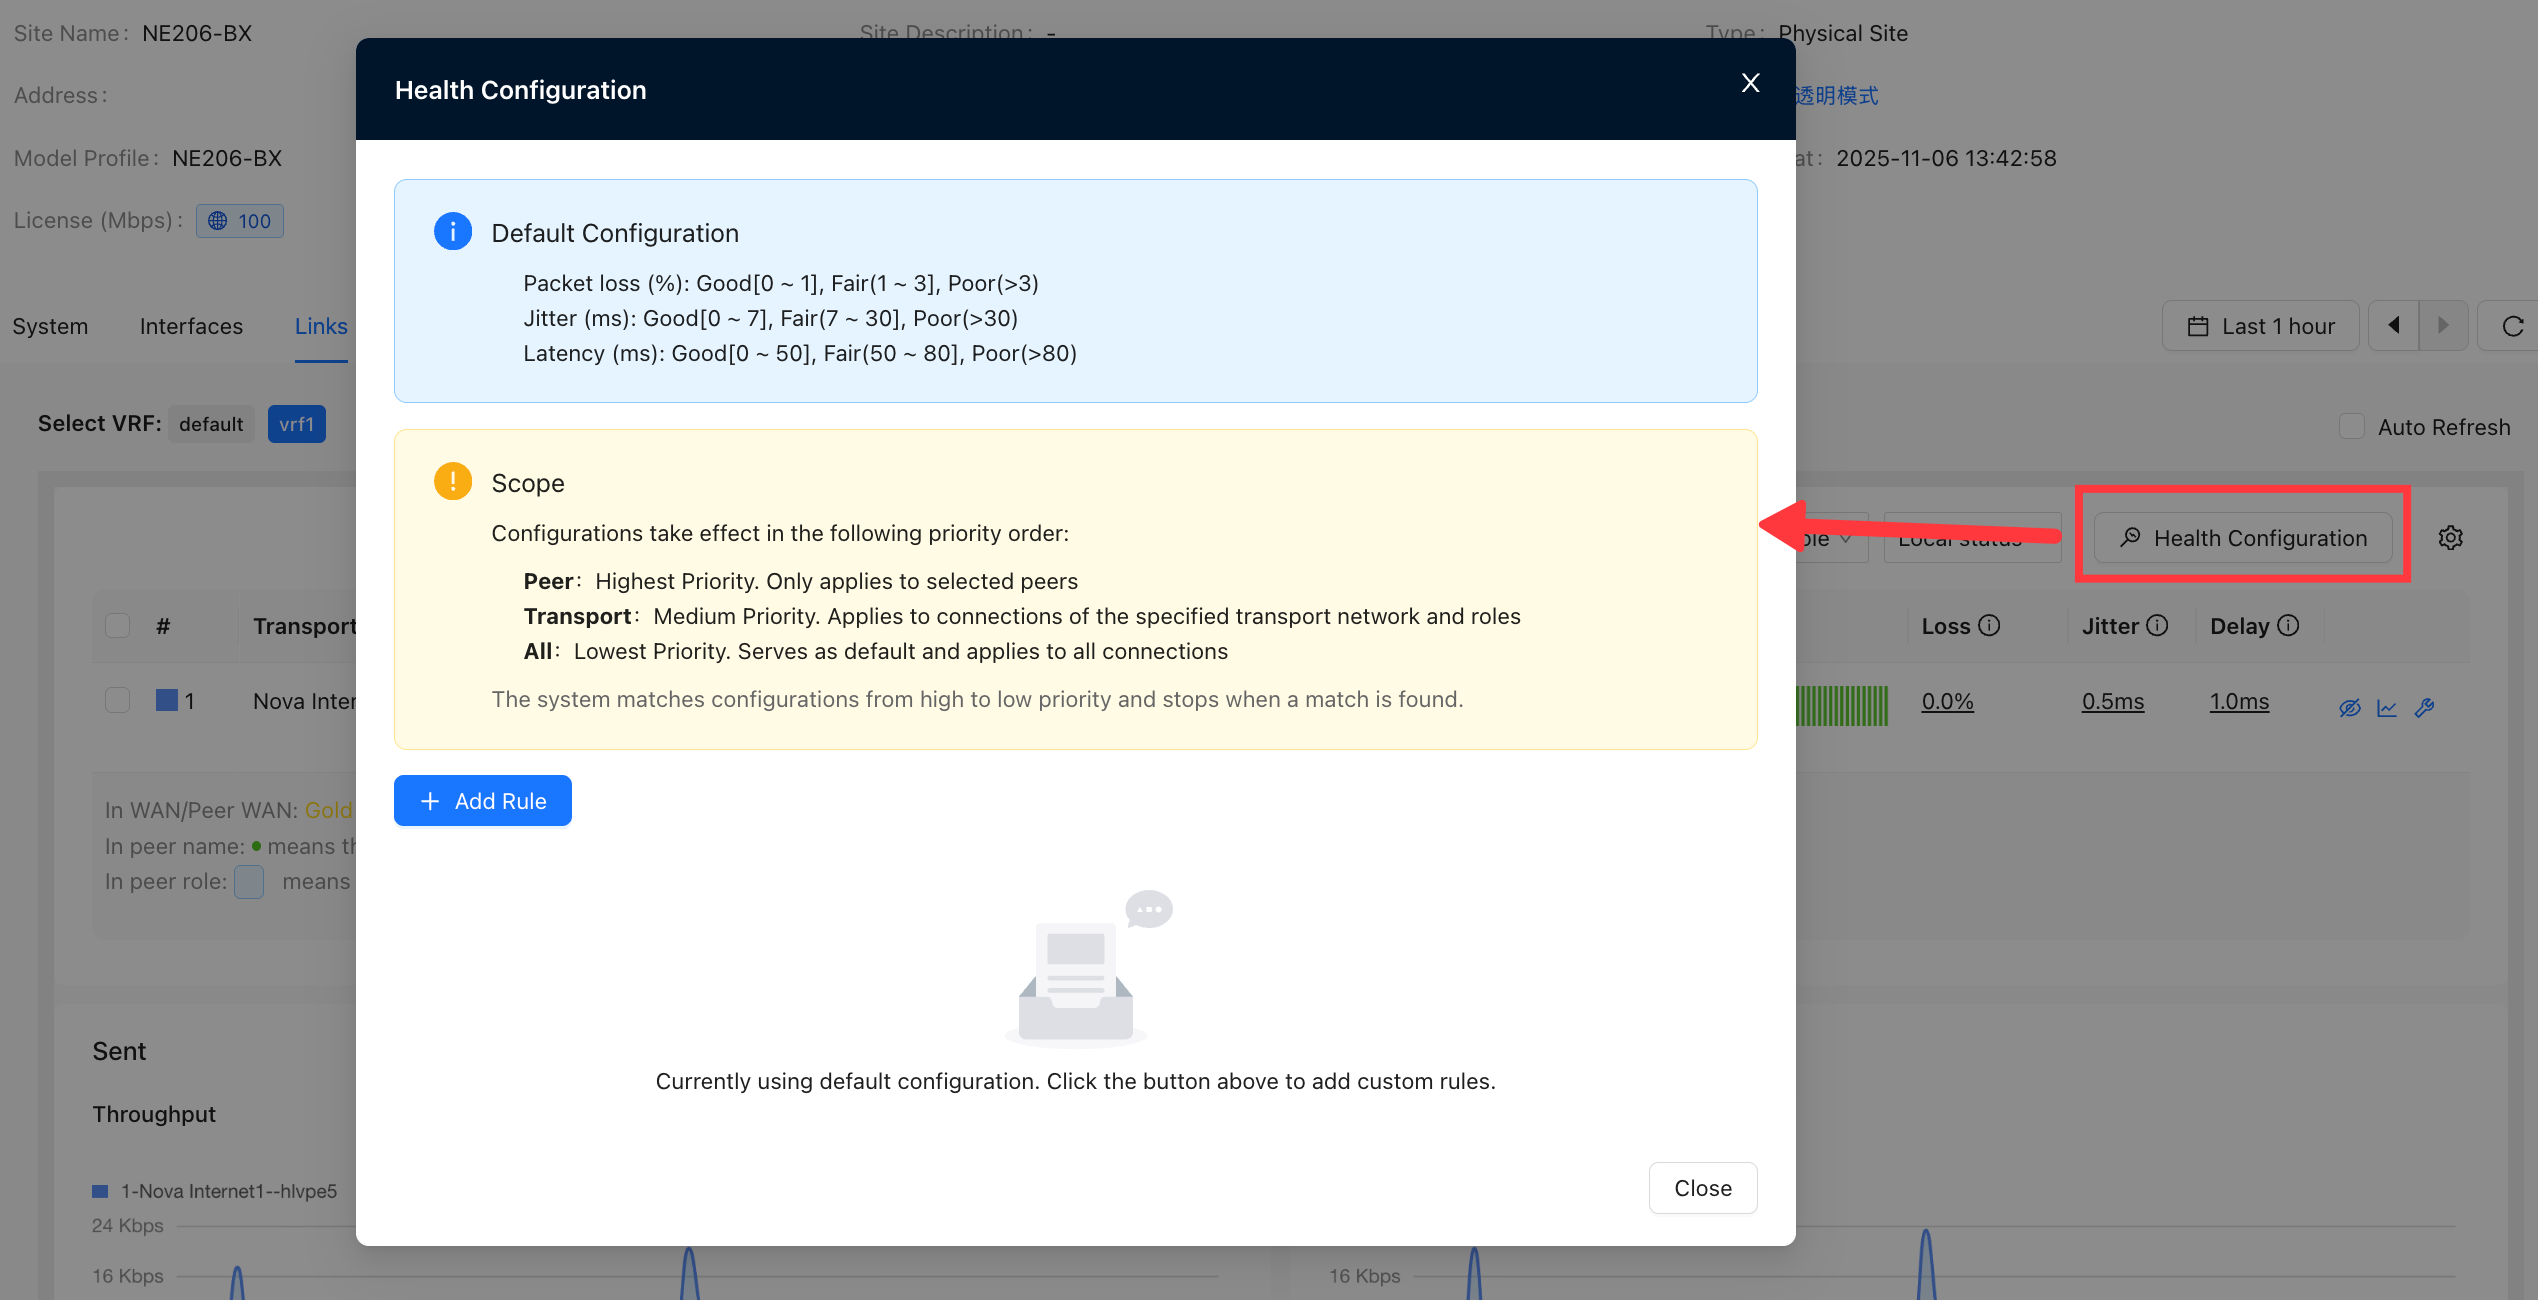
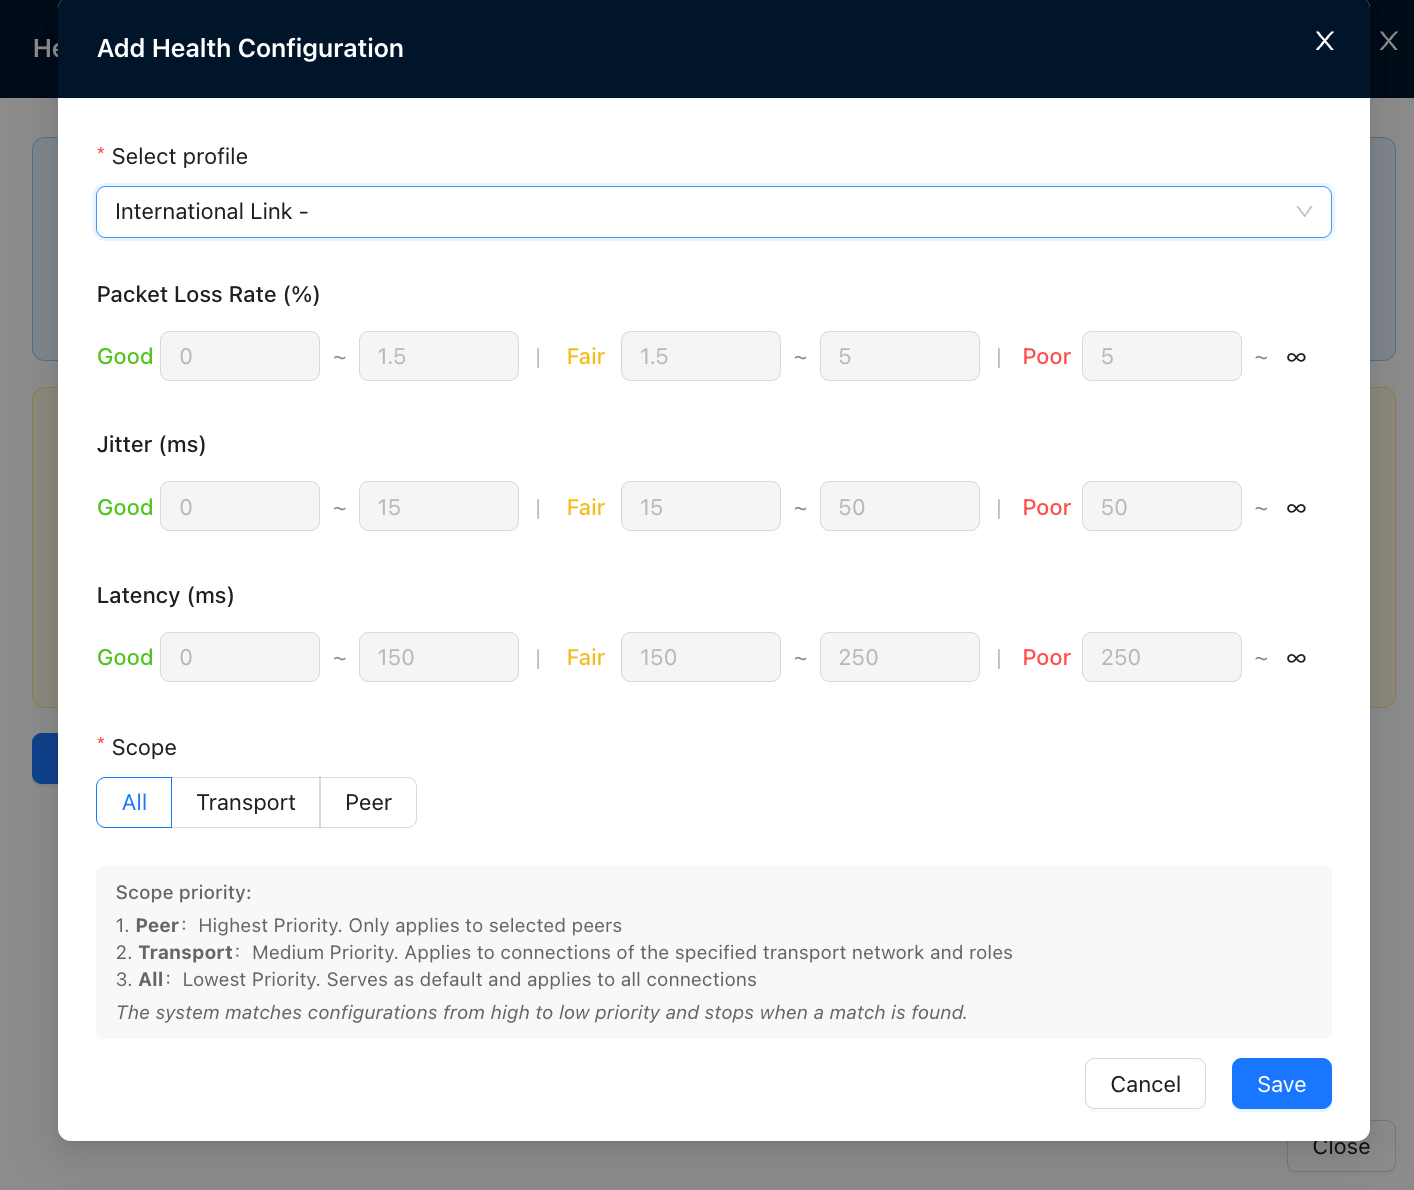
Health configuration
- Health Configuration allows you to customize link health thresholds.
- Example: For an international link with high latency, the default health level may remain red and fail to reflect the actual link quality. You can customize the health thresholds to make the displayed health status more accurate.
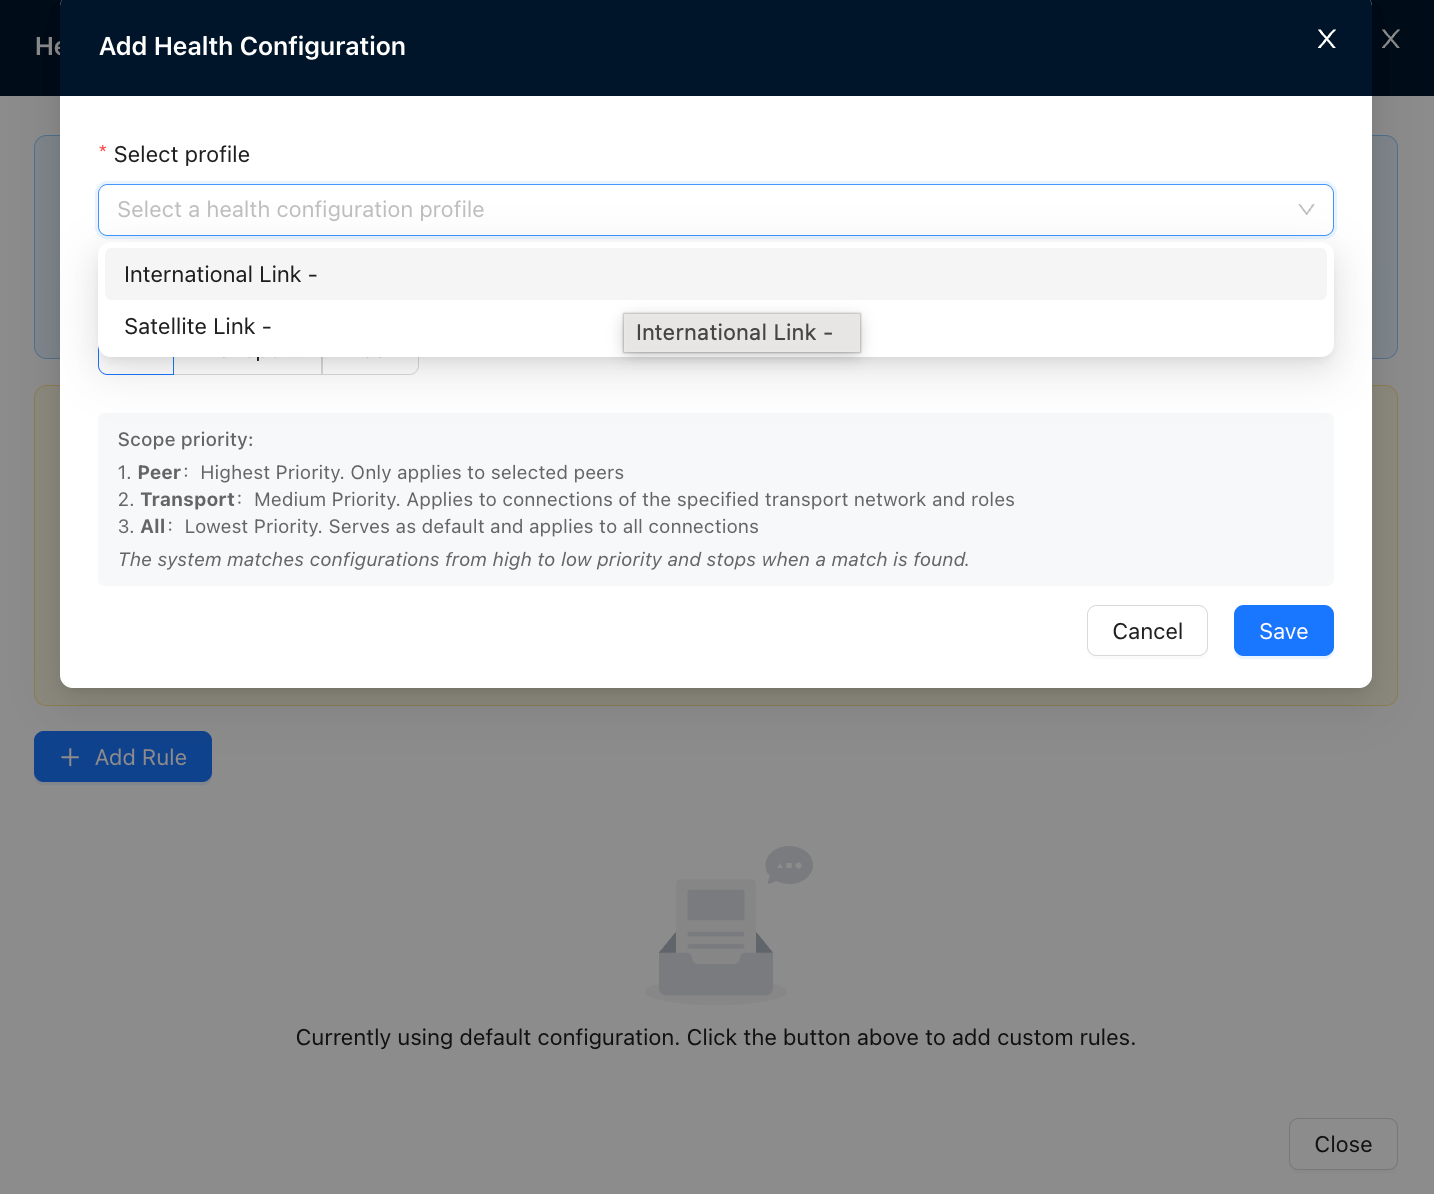
Click "Health Configuration" to open the link health configuration dialog.
Click "Add Rule" to add a health configuration rule.
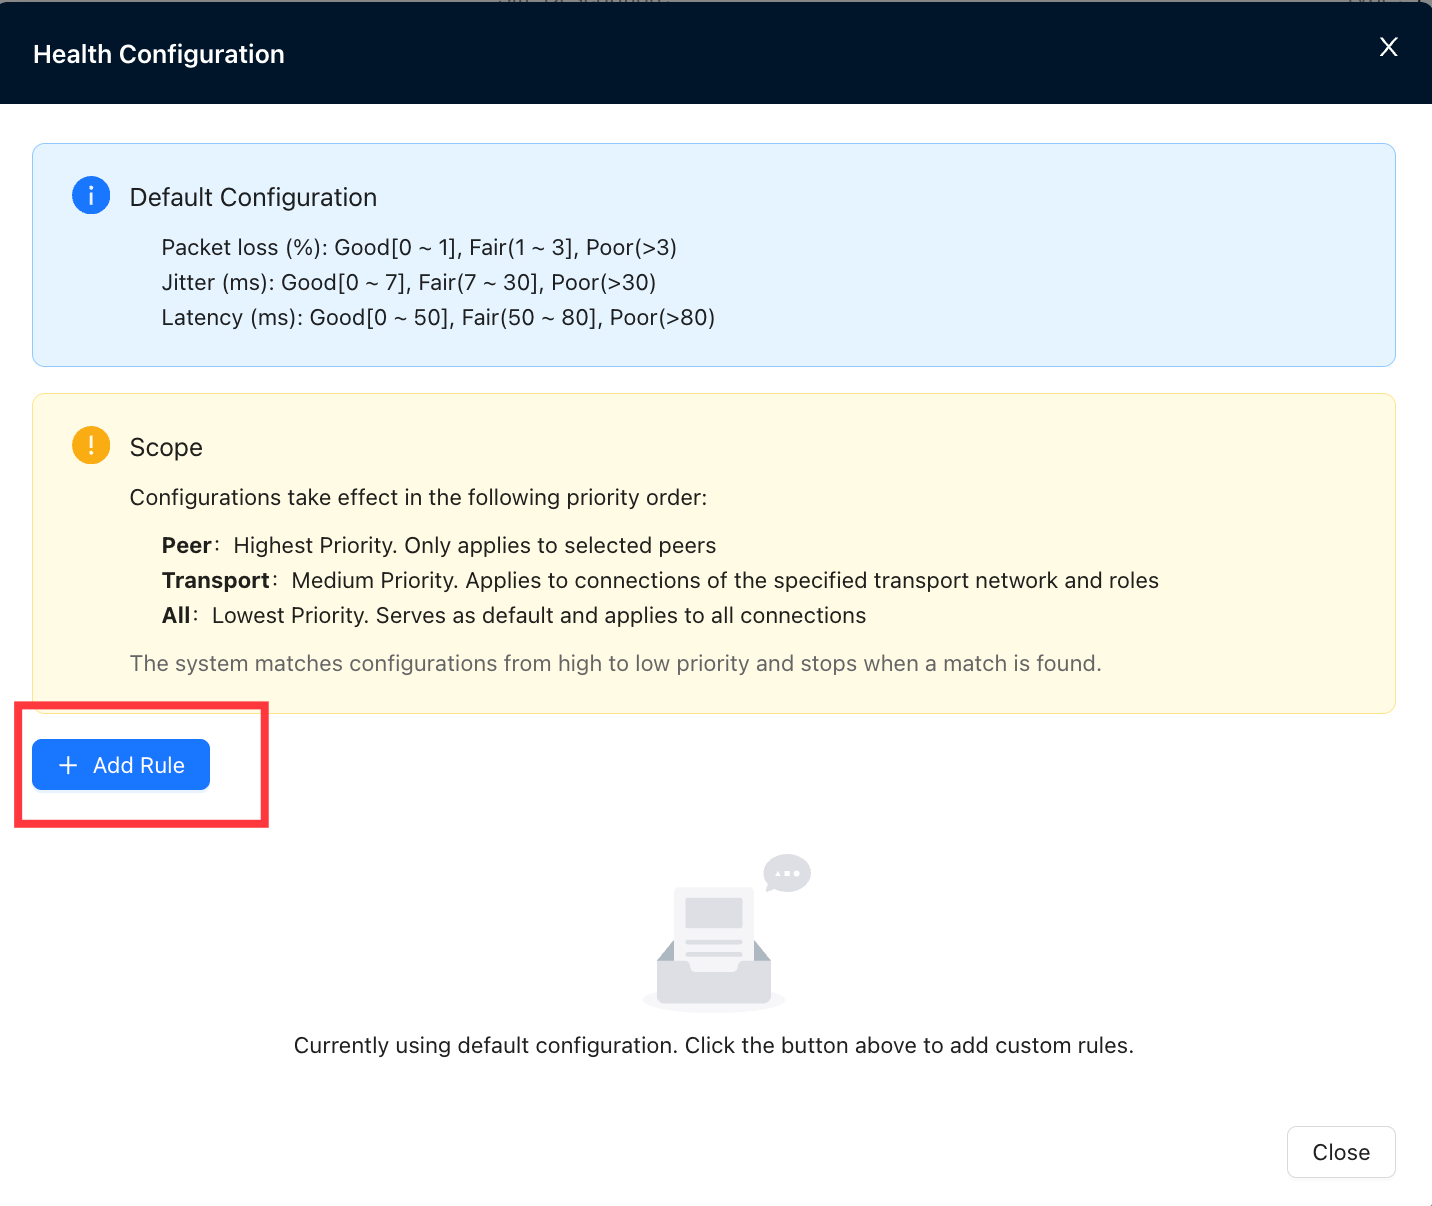
In the configuration dialog, select a health configuration profile, as shown below.
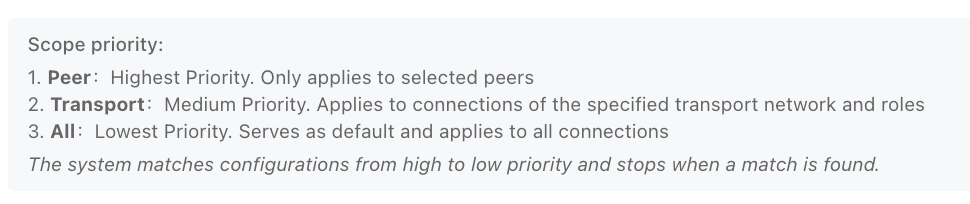
The scope and effective priority are described below.
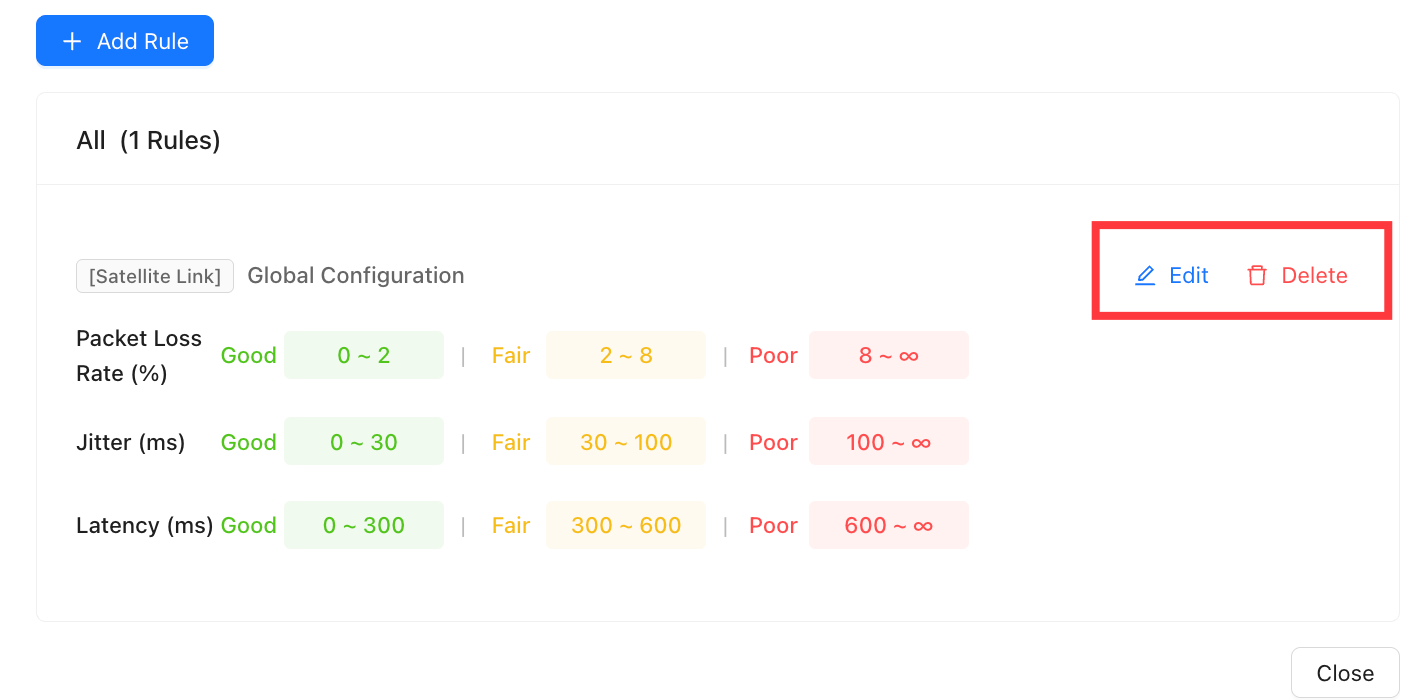
Rules can also be edited or deleted.
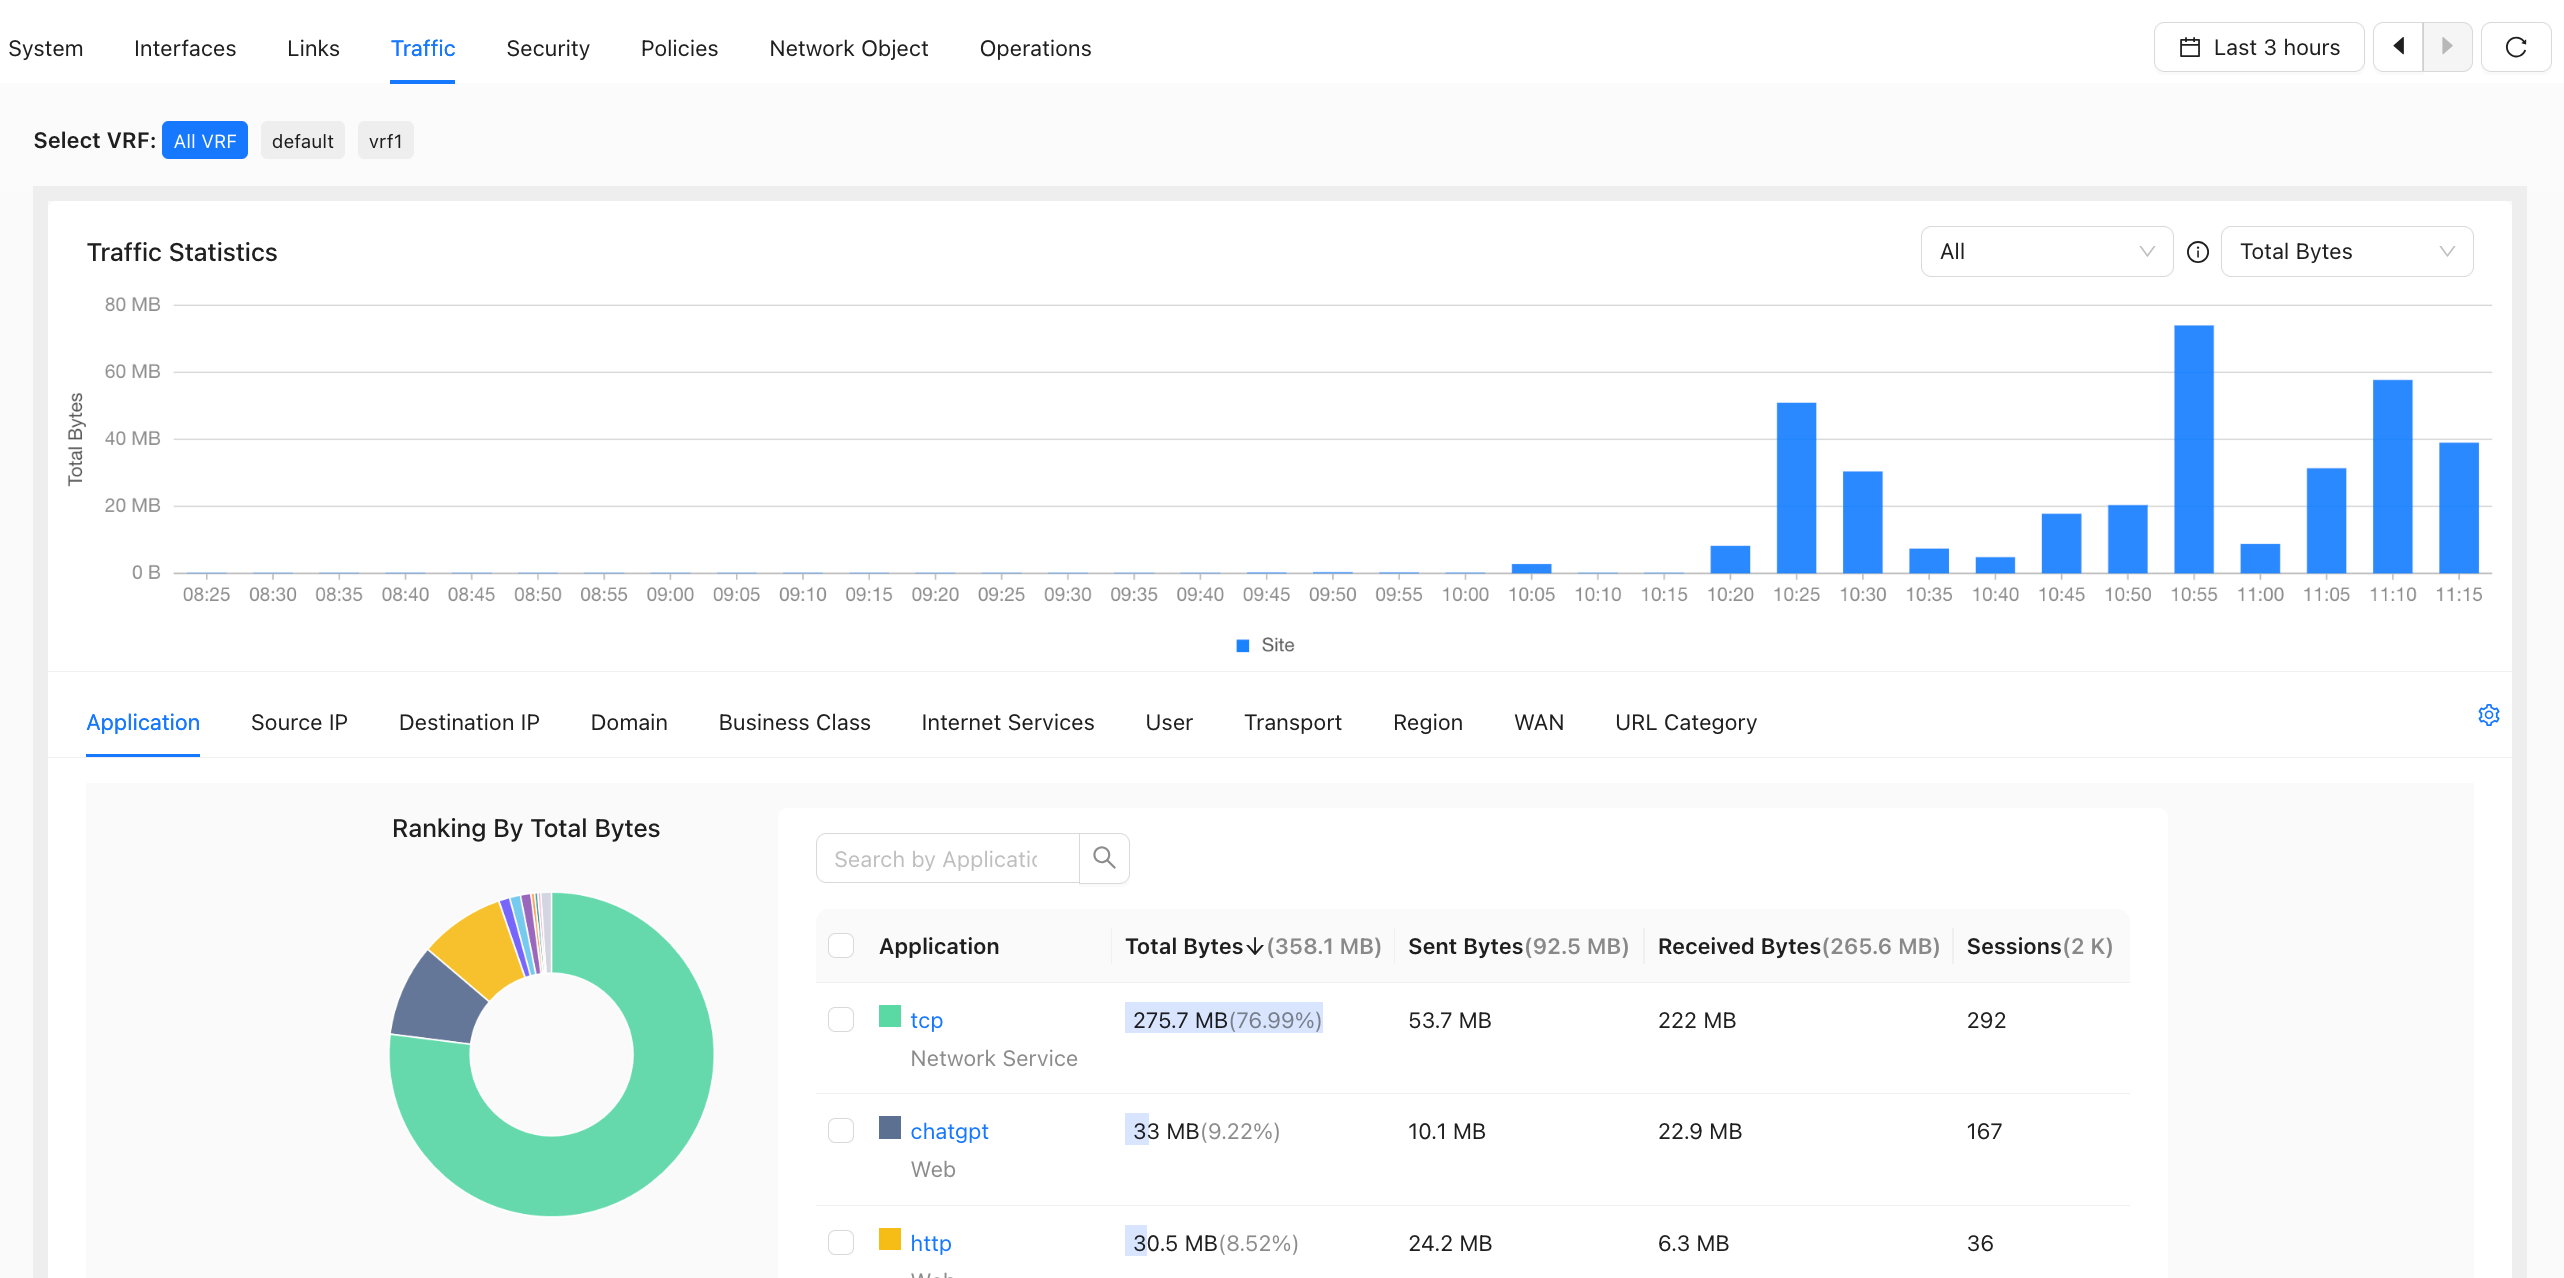
Traffic
- View site traffic statistics. The maximum query range is the last 7 days.
Application
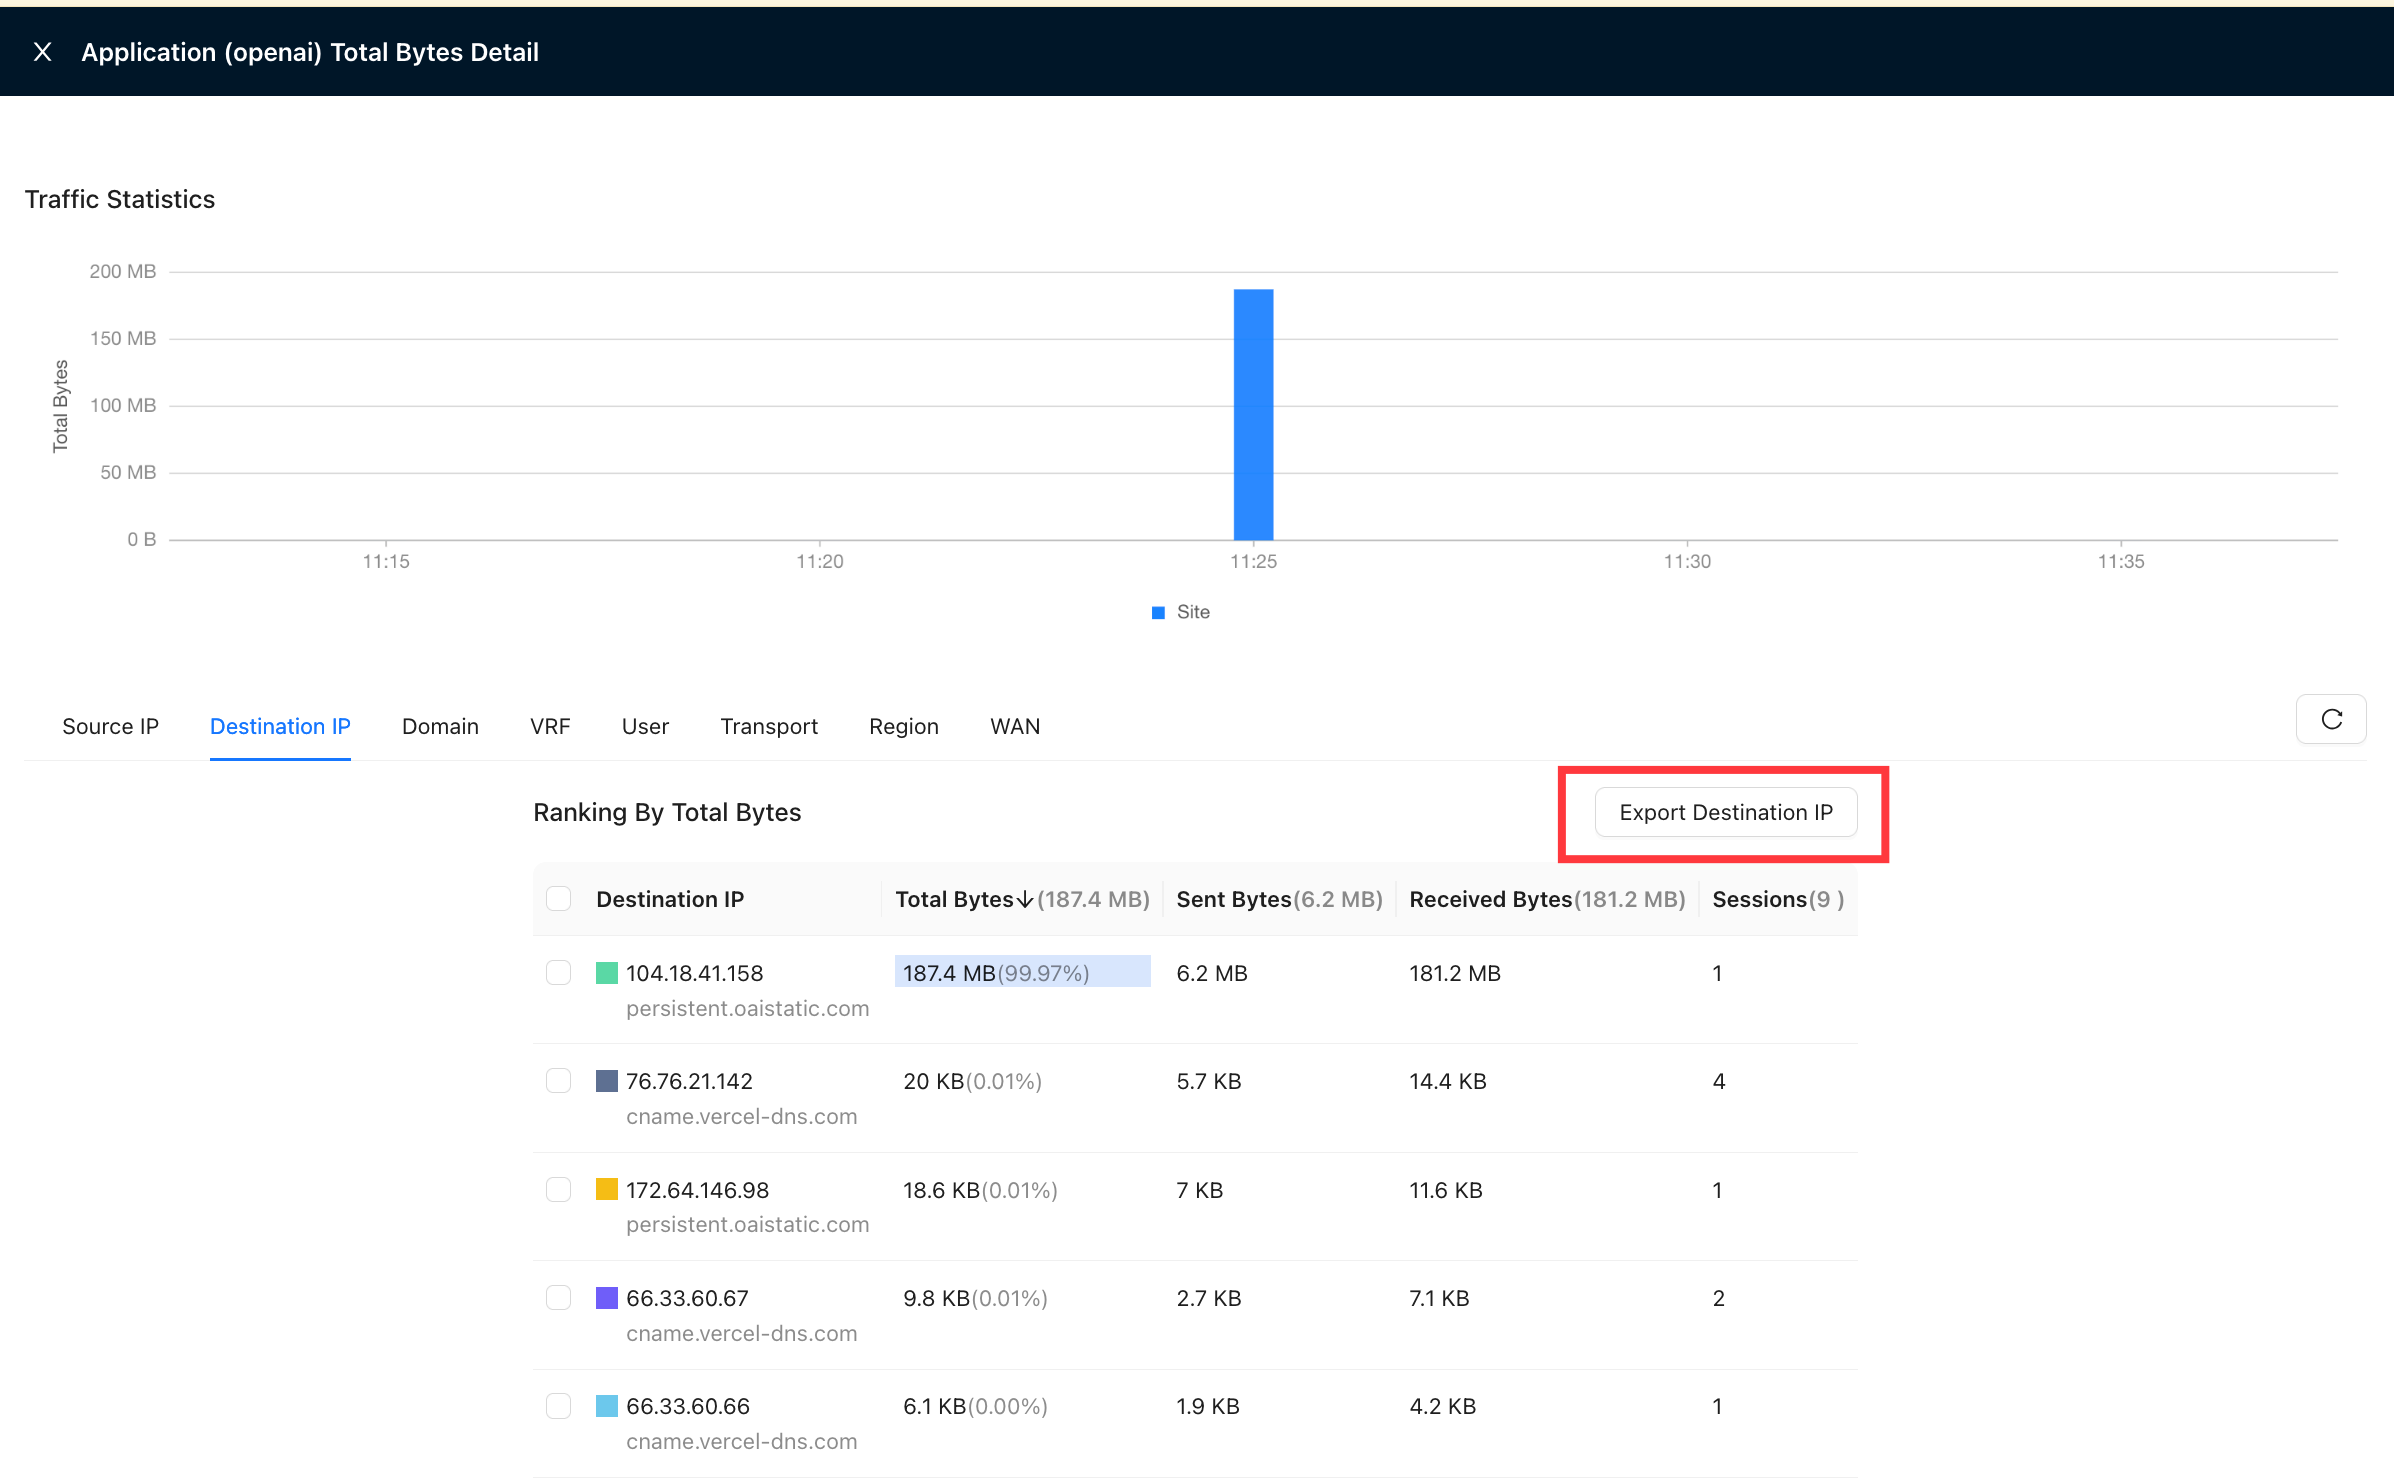
Click an application name. In "Traffic to Each Destination IP", click Export Destination IP to export the destination IP addresses accessed by the application, as shown below.
Only records from the last 7 days can be exported.
- This page exports destination IP addresses accessed by the selected application at the selected site.
- To query destination IP addresses accessed by a specific application at this site, use Application IP Query under "Sites" → "Device Diagnosis".
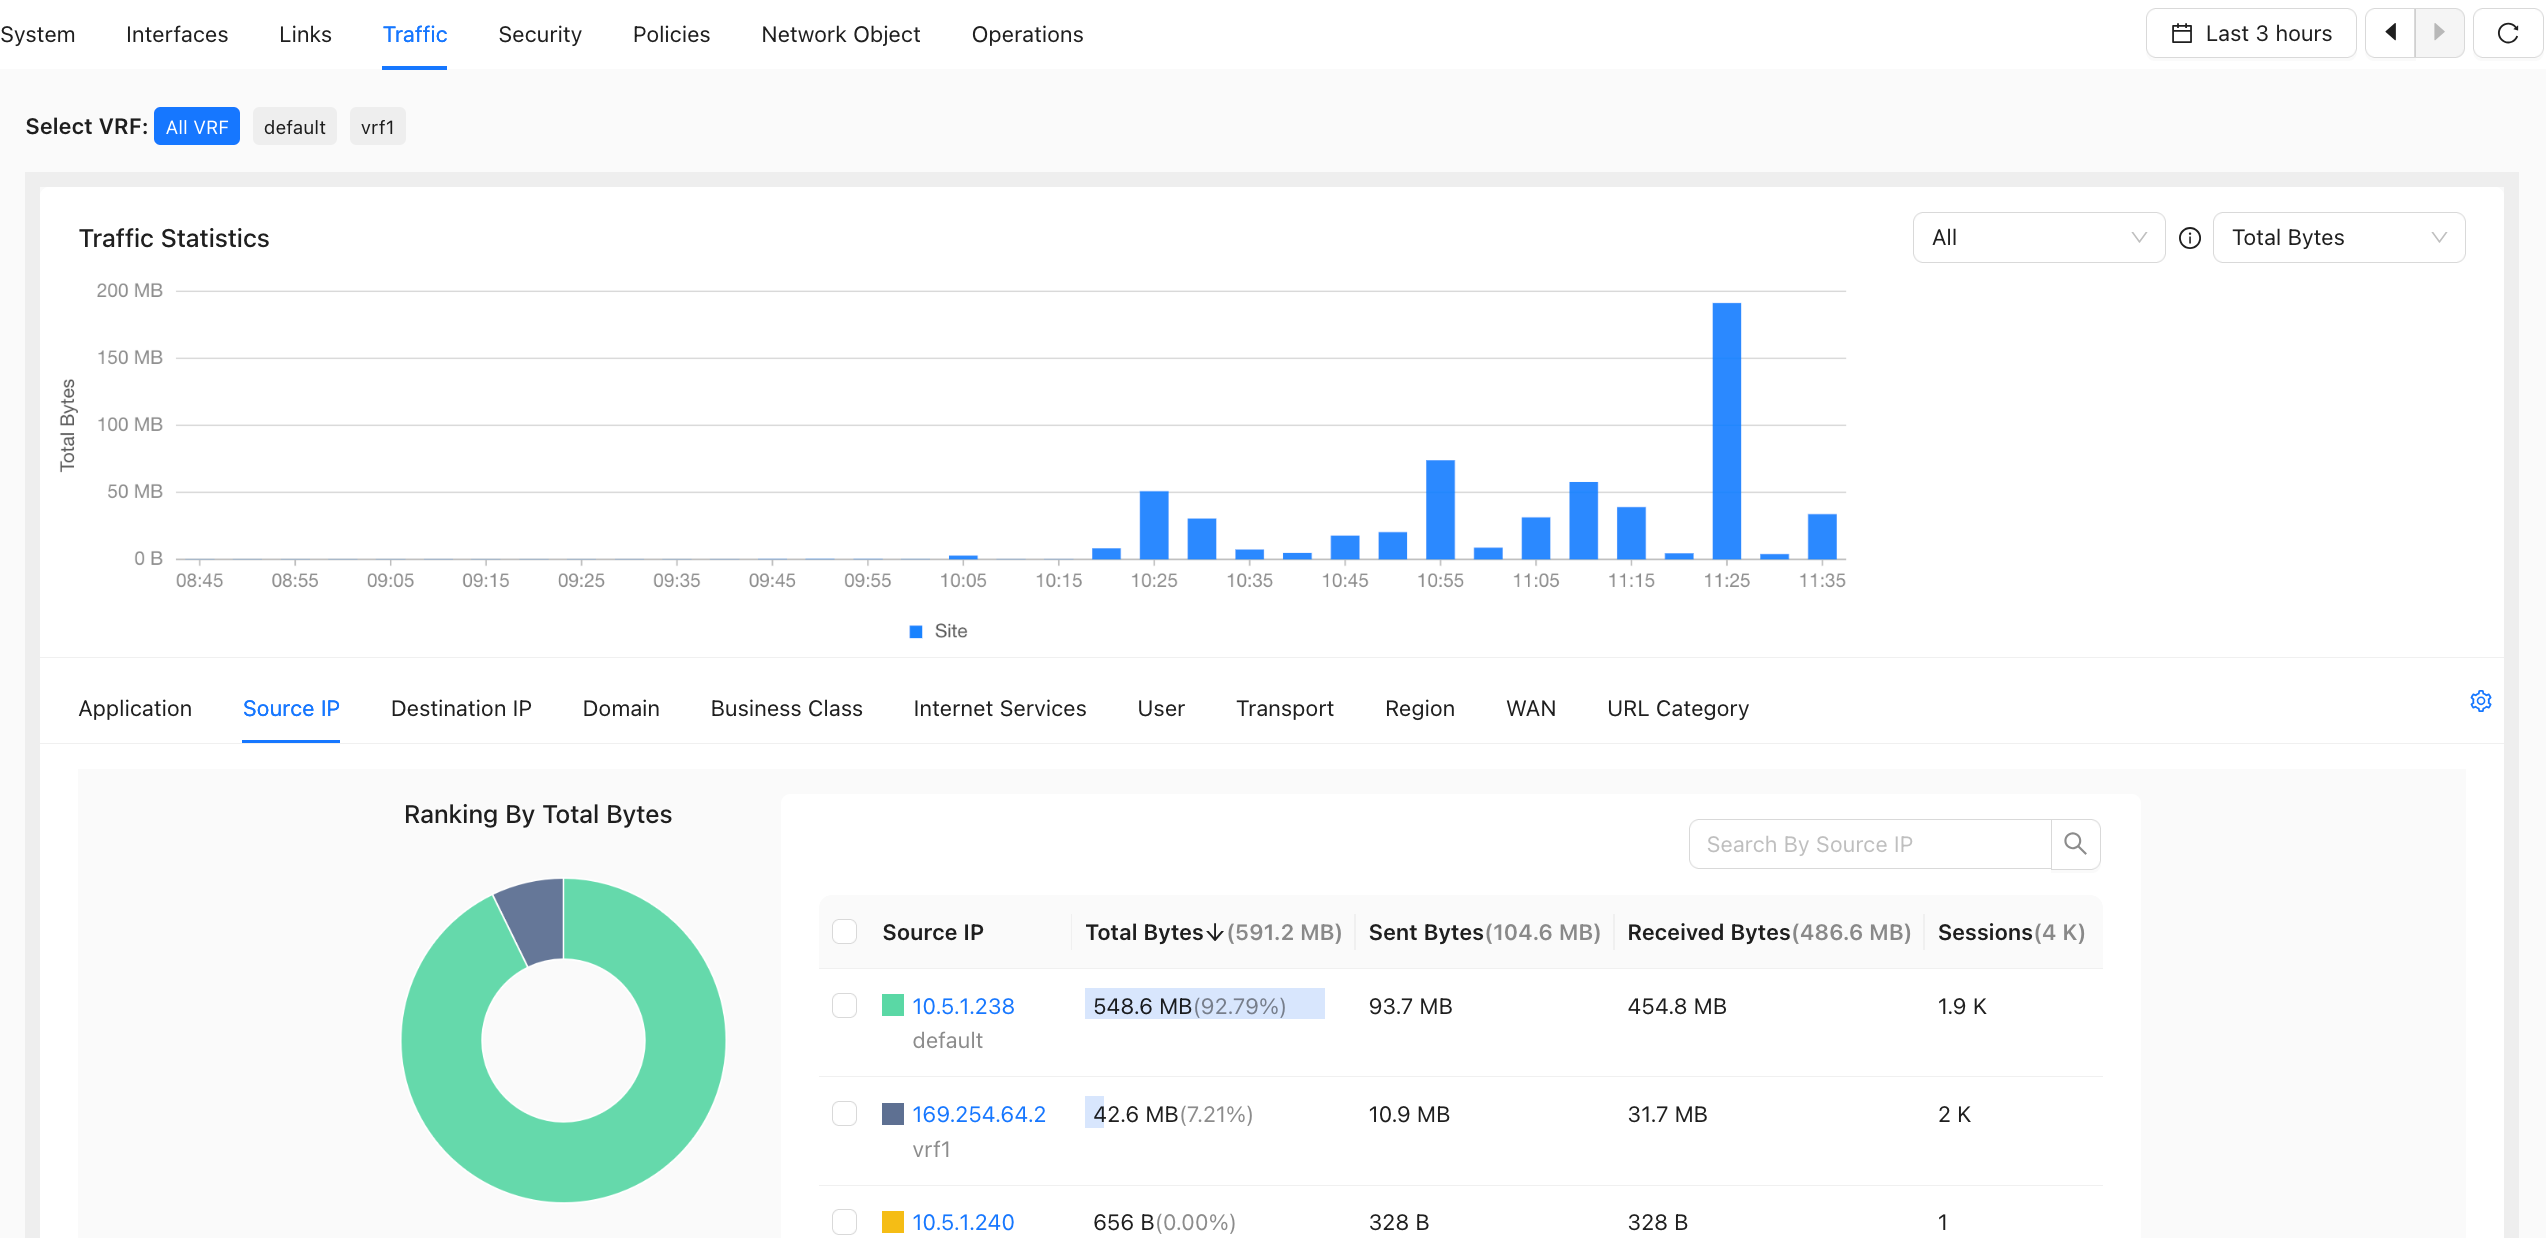
Source IP
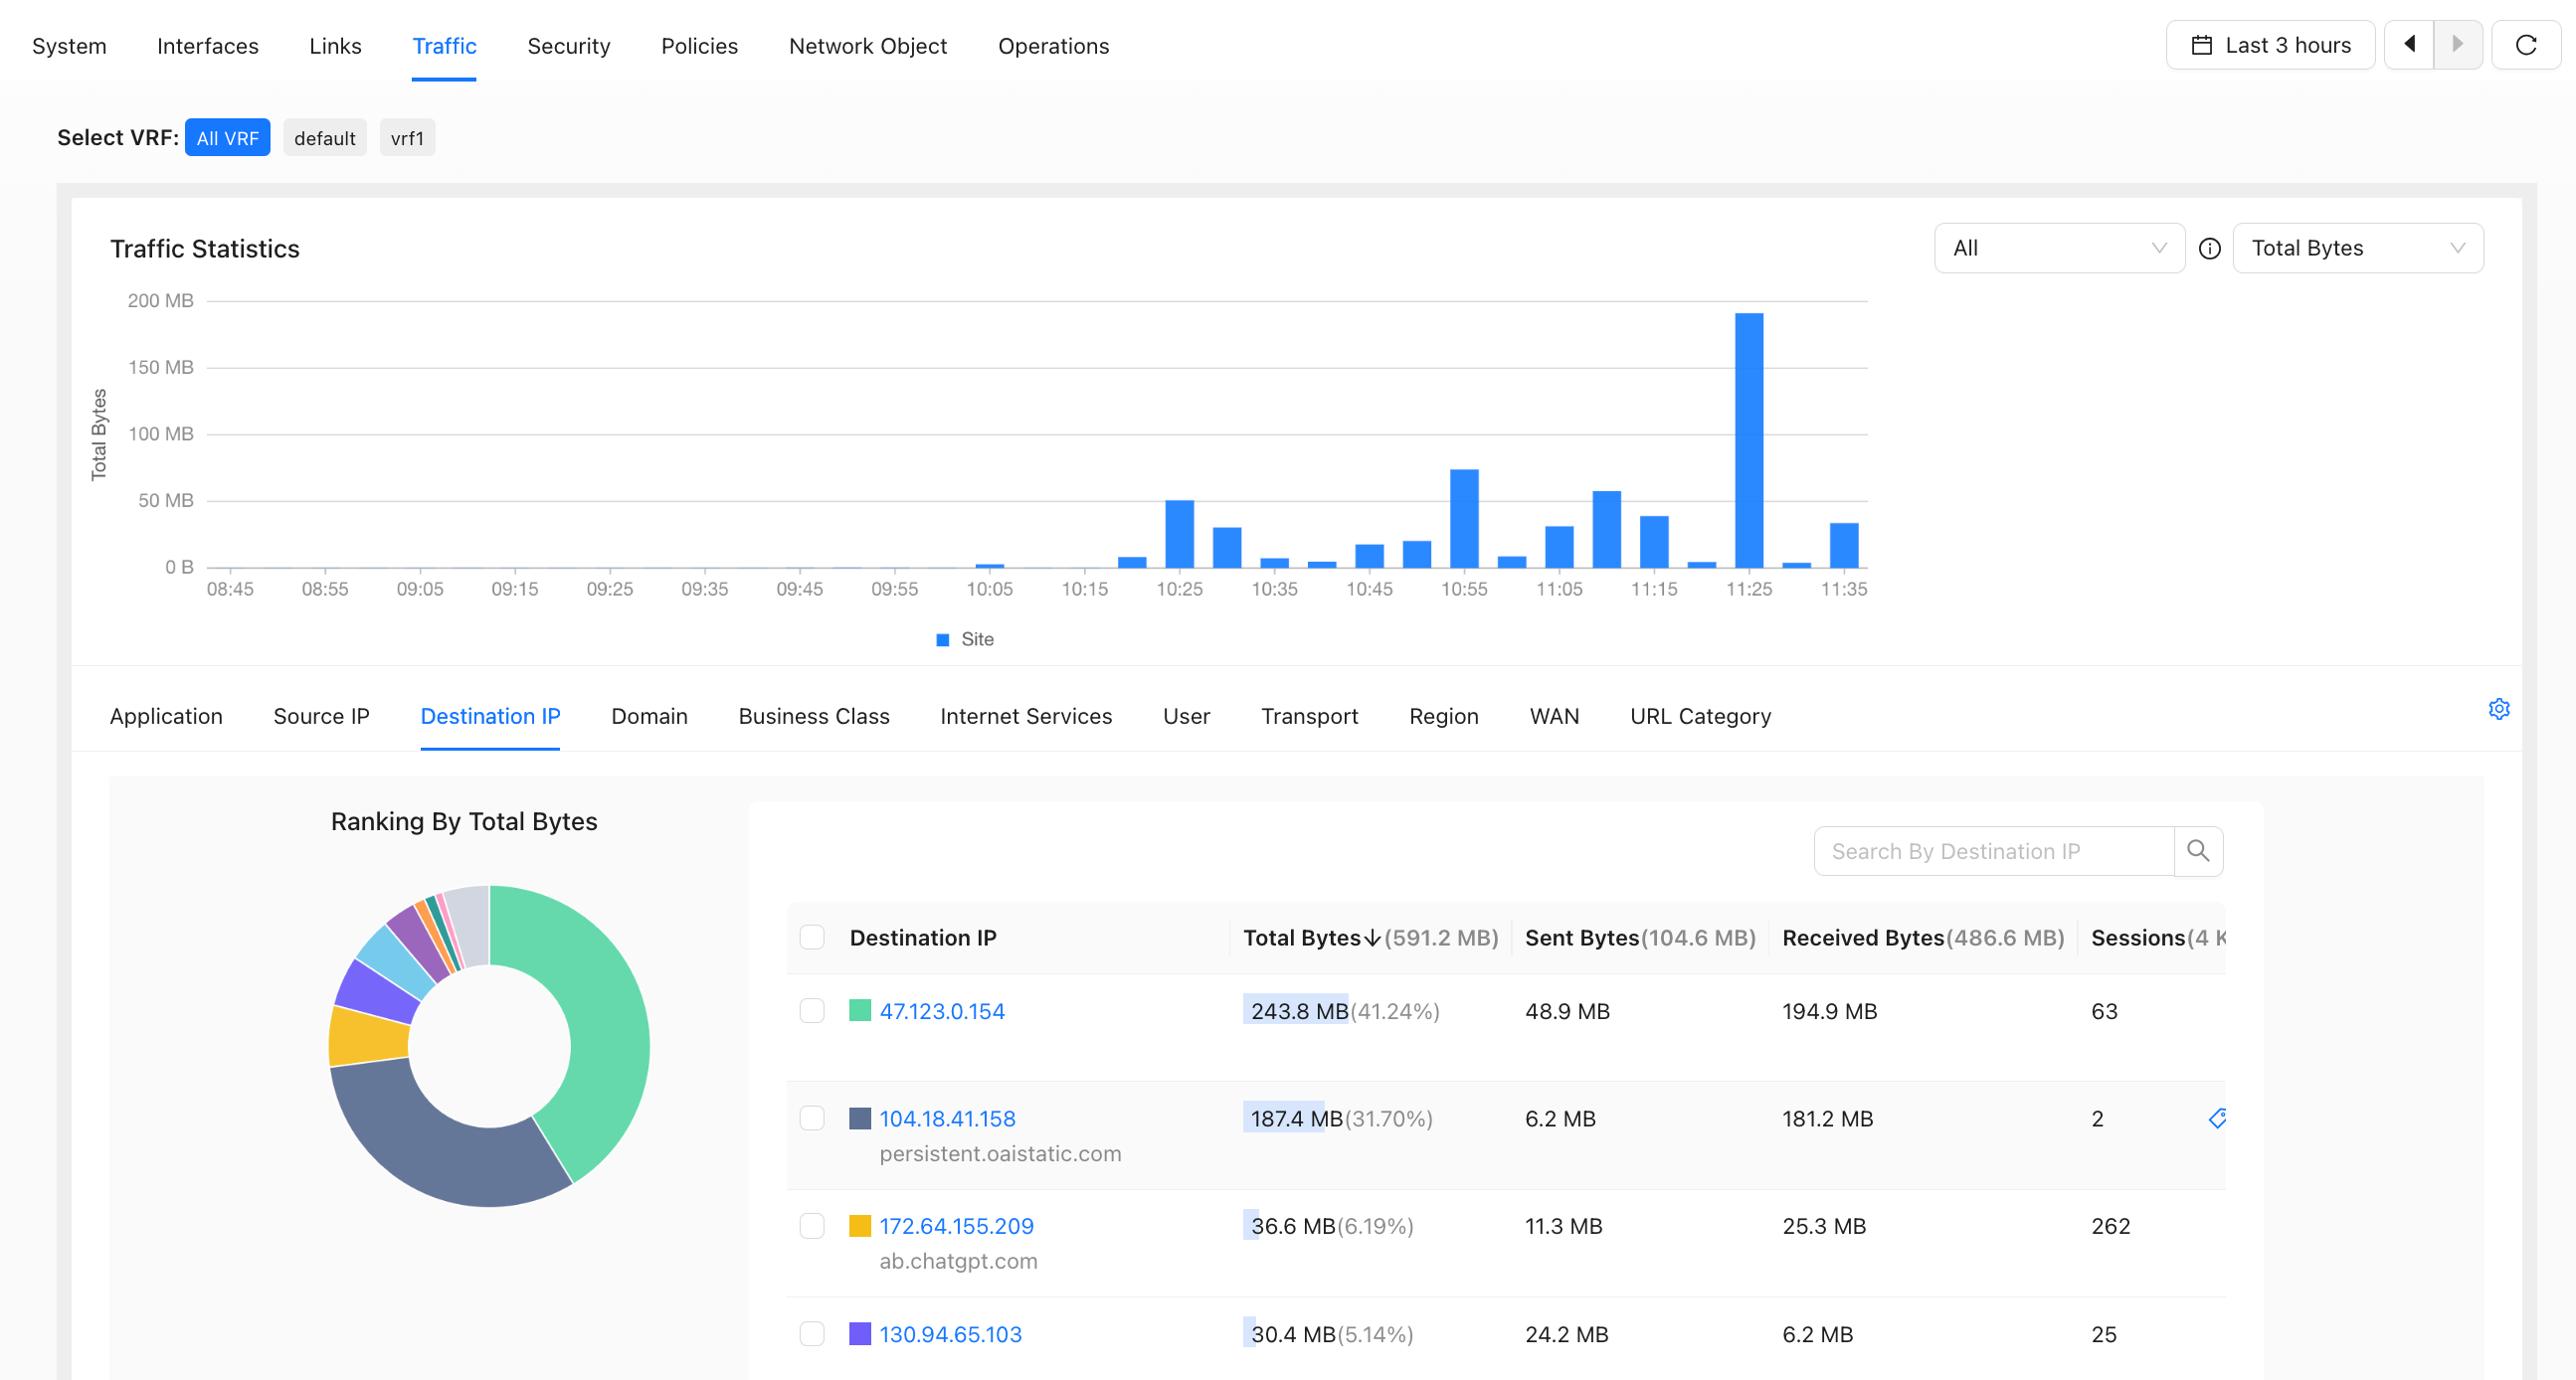
Destination IP
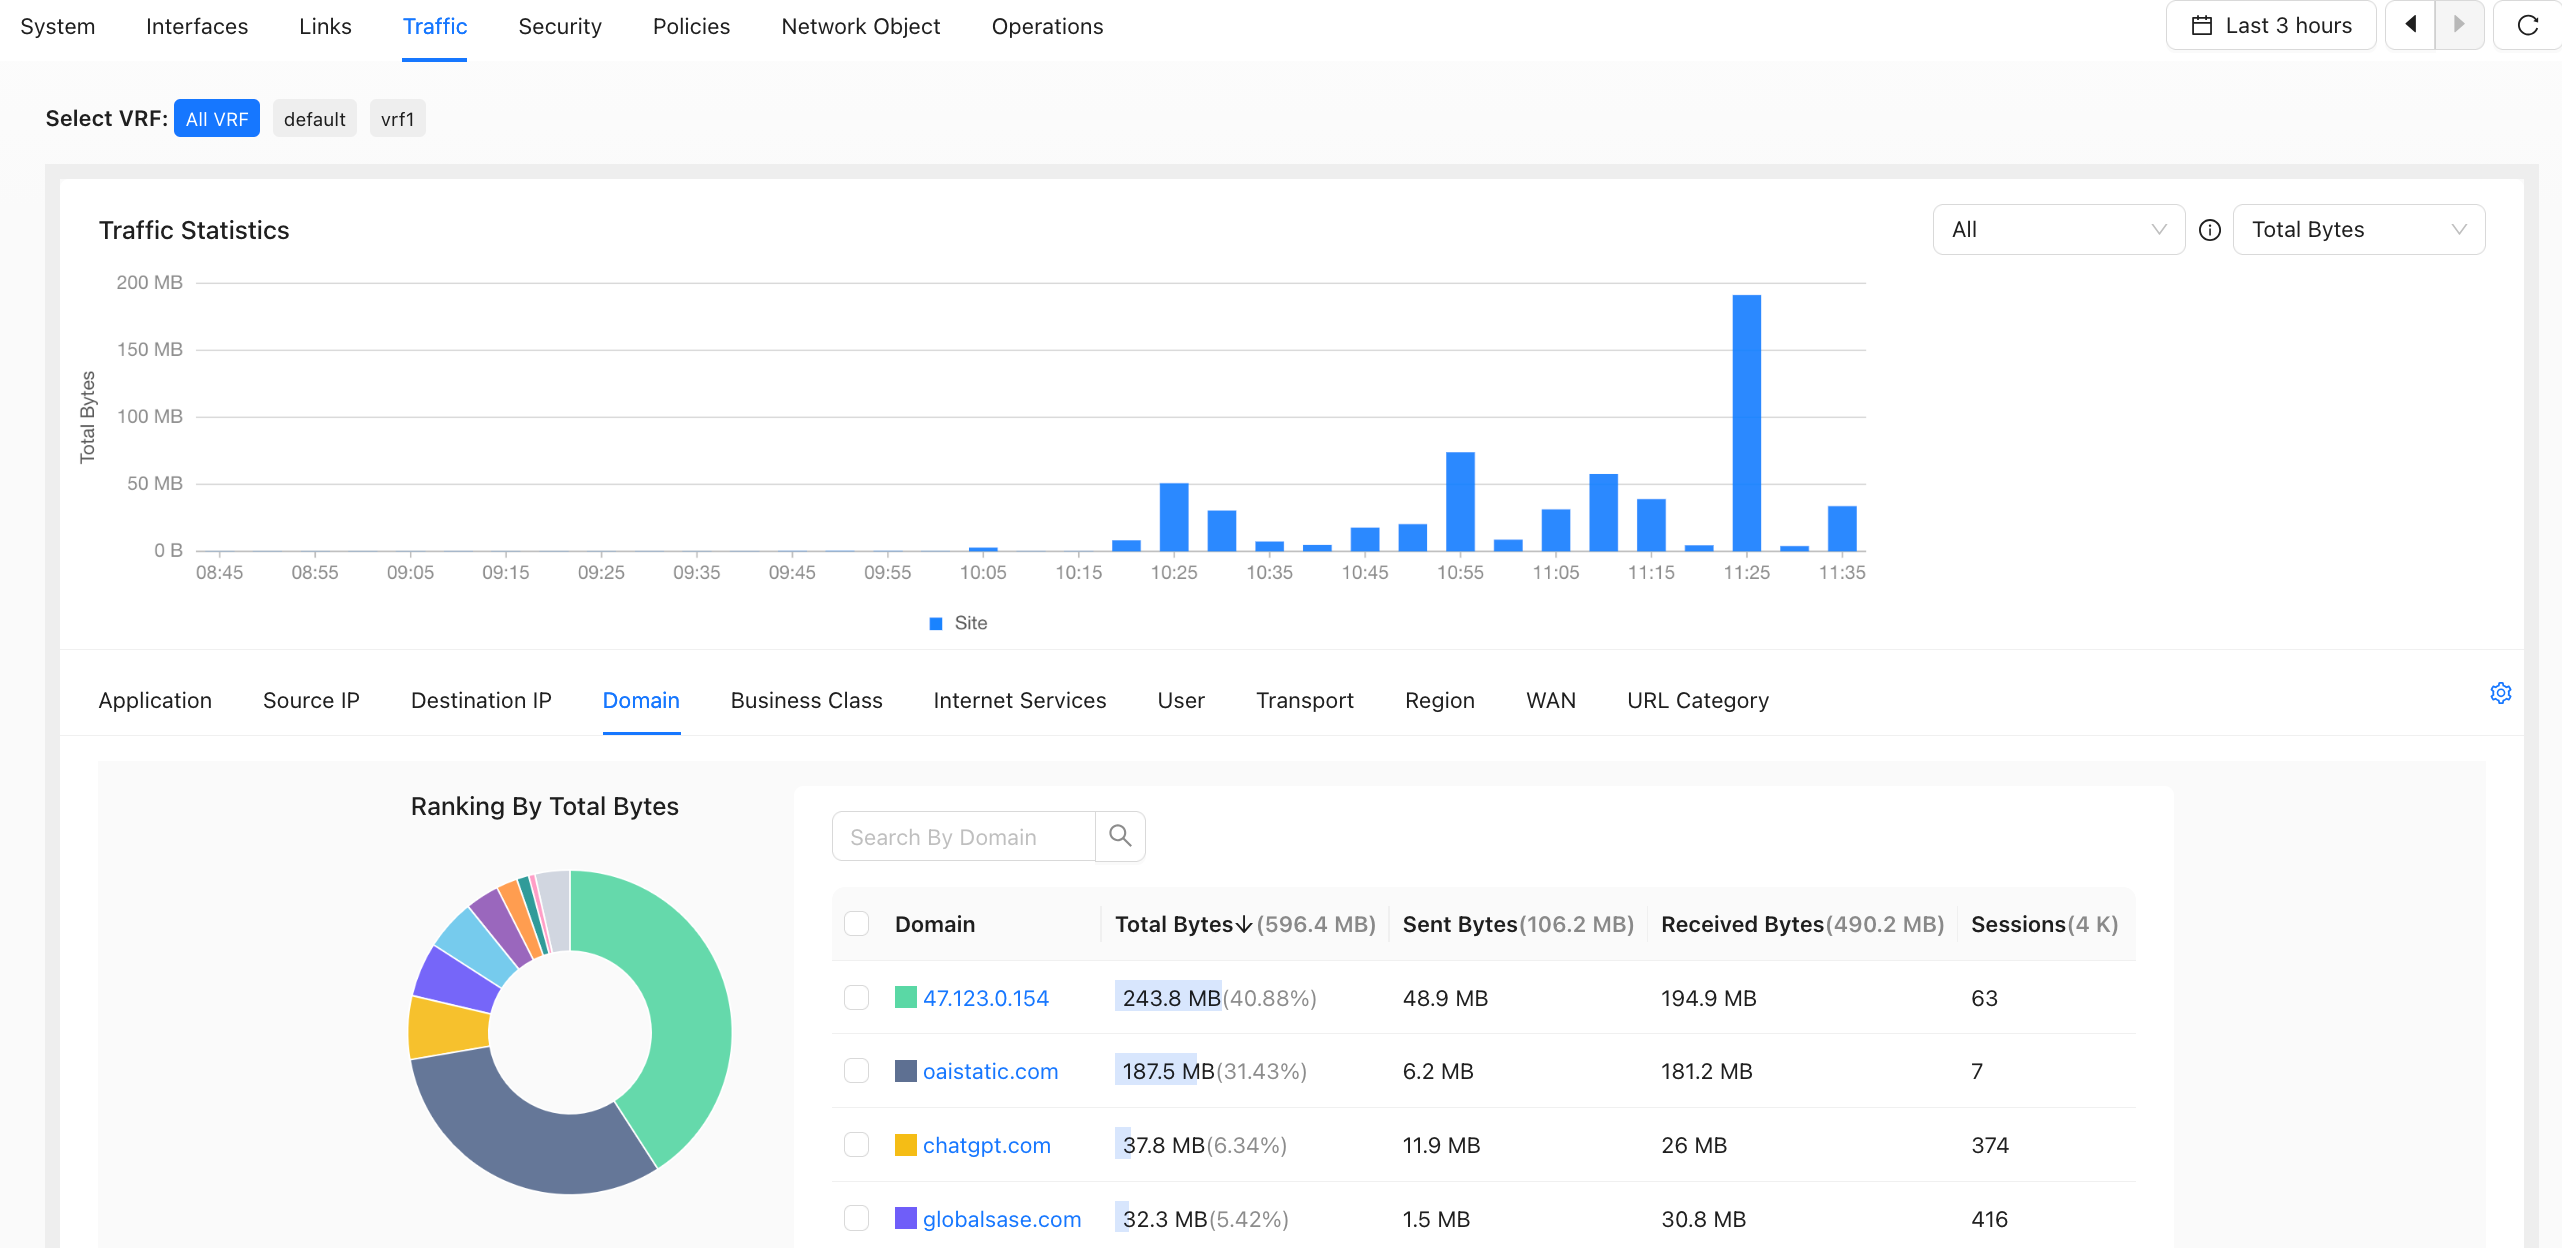
Domain
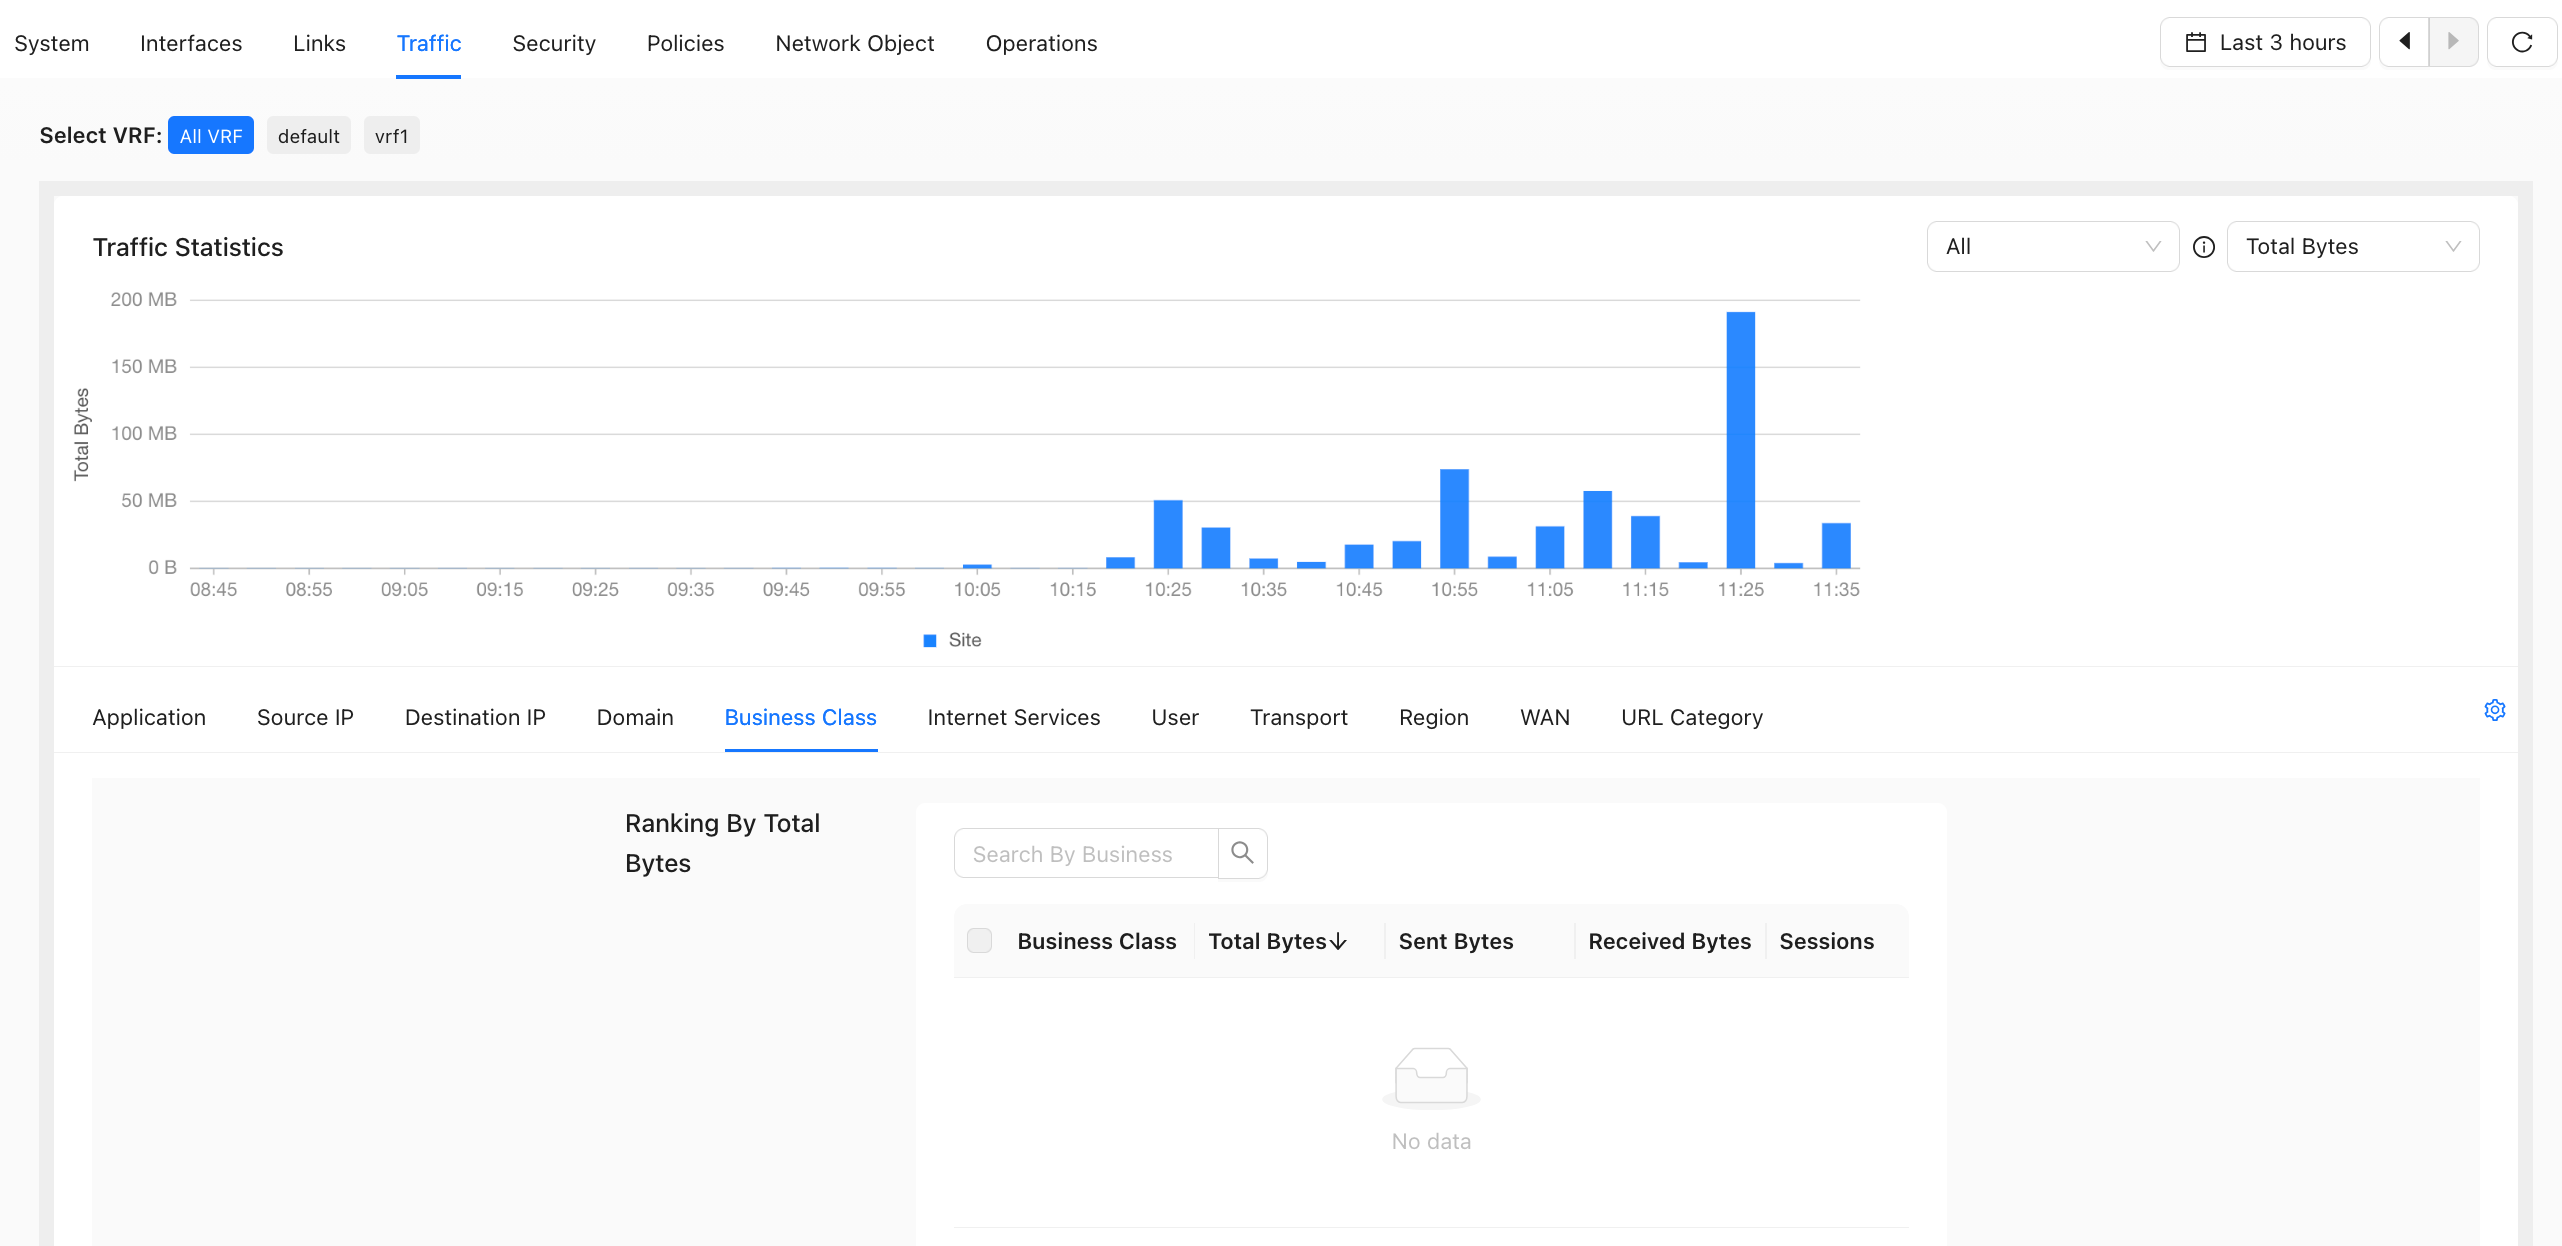
Business Class
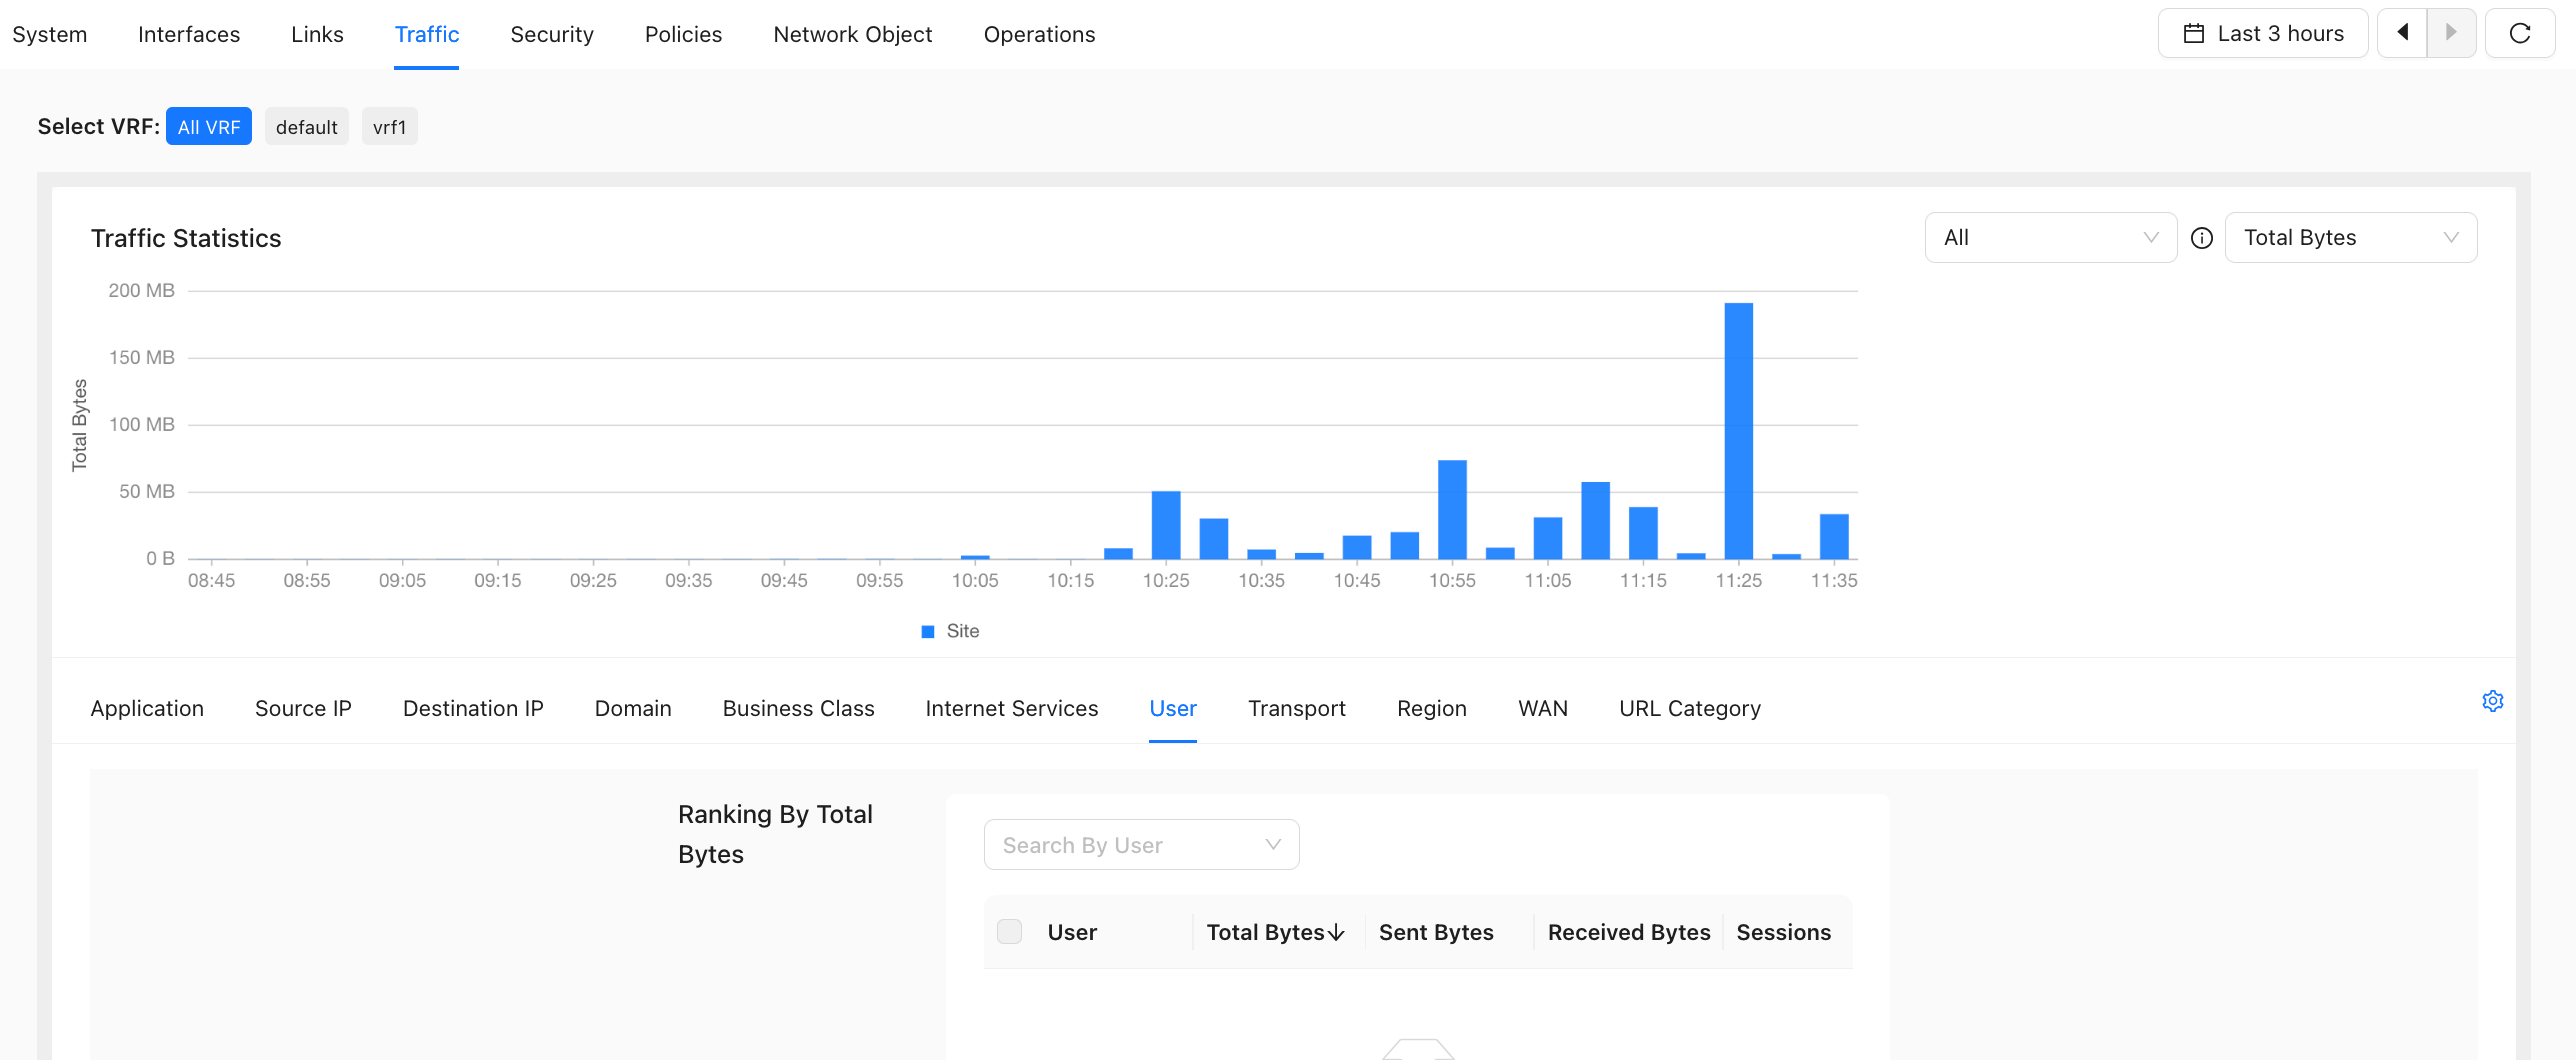
User
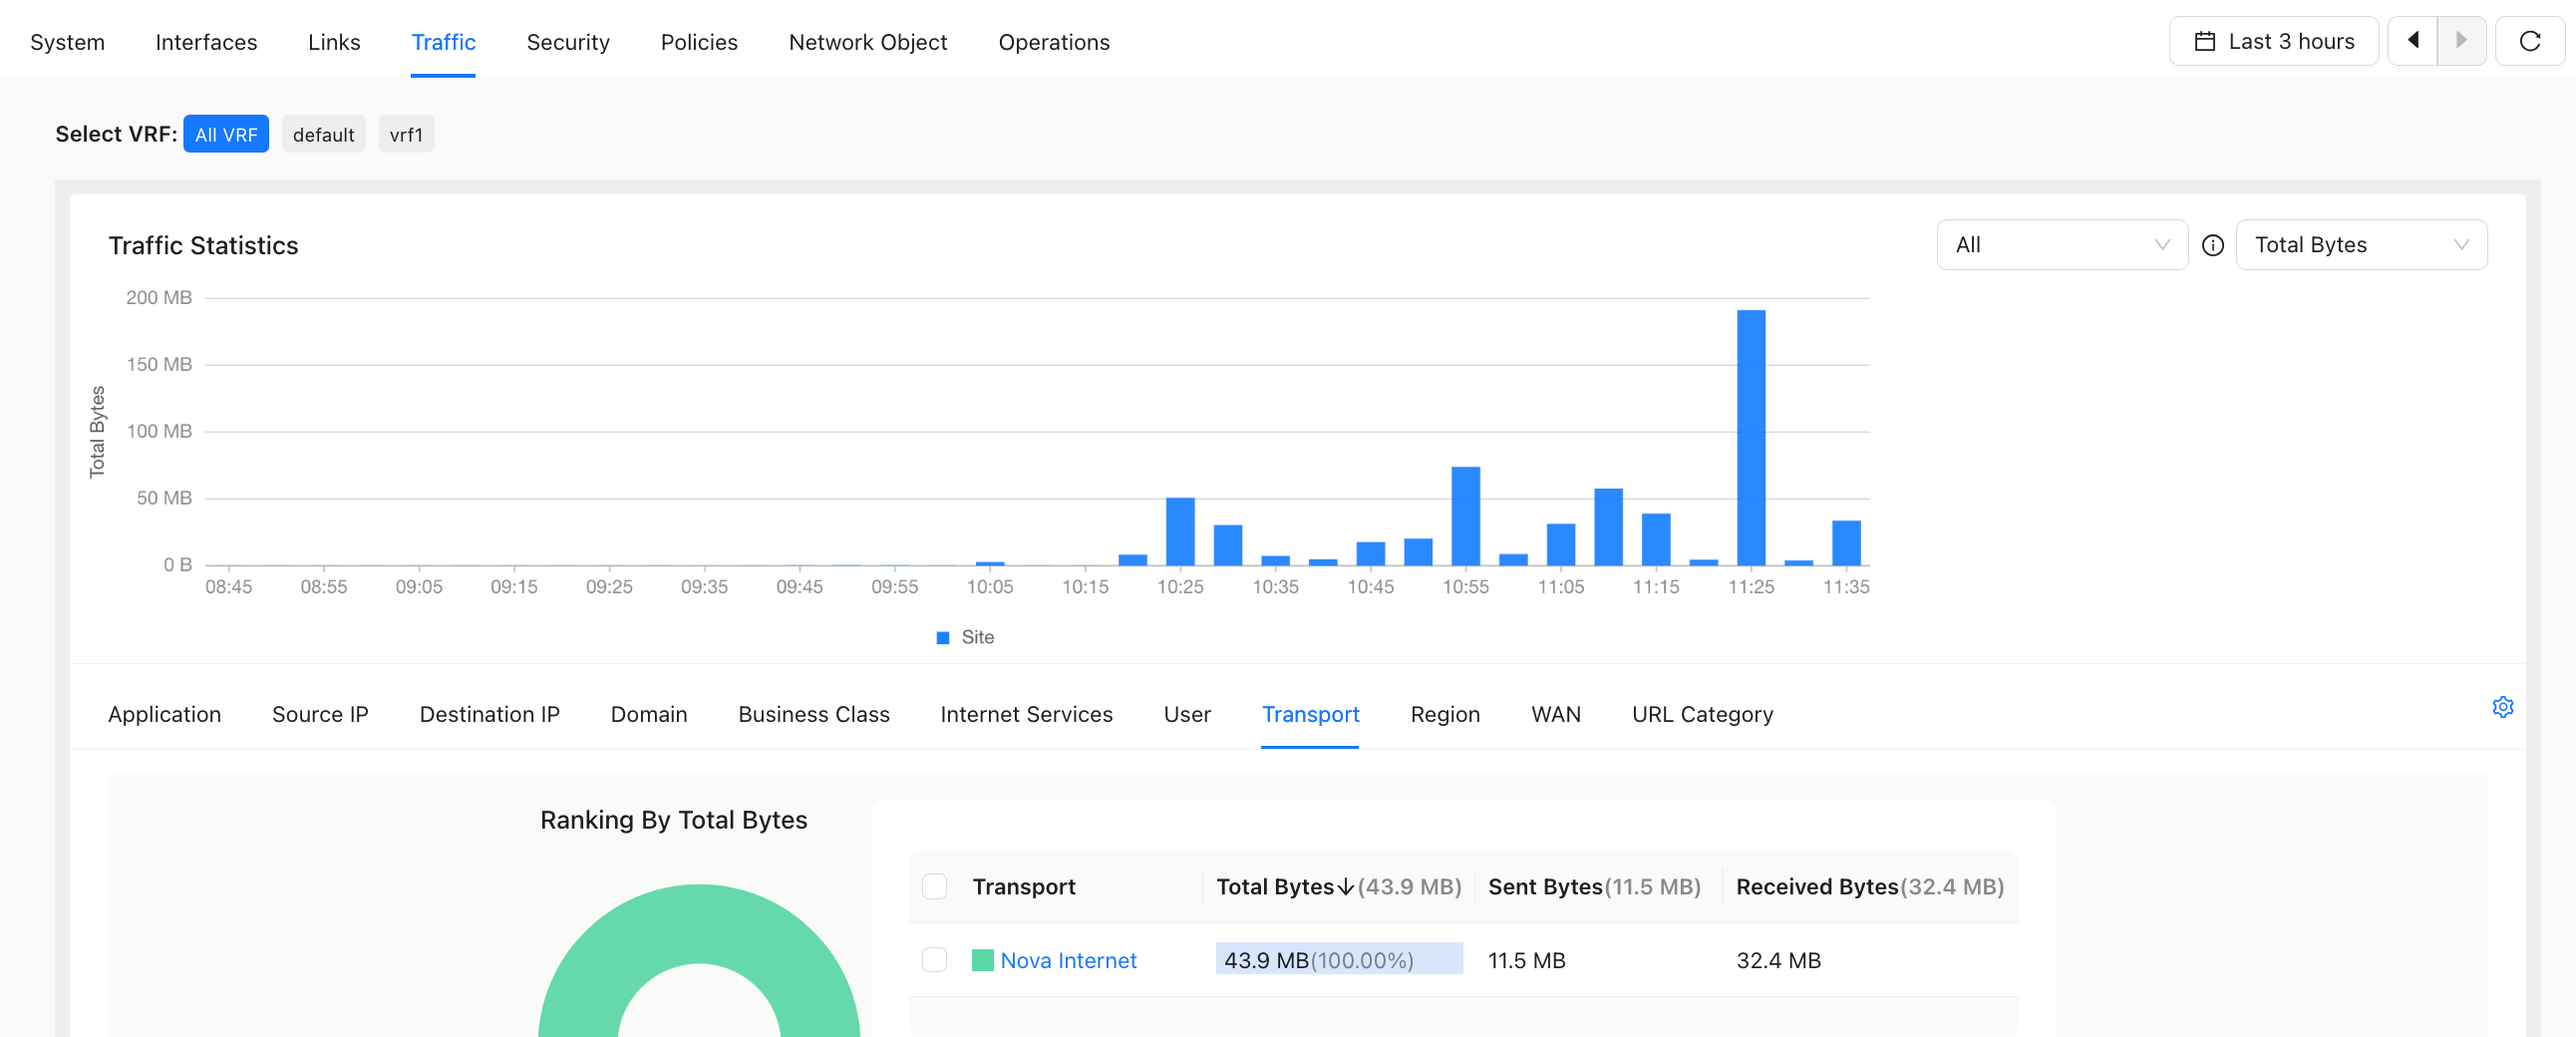
Transport Network
Country/Region
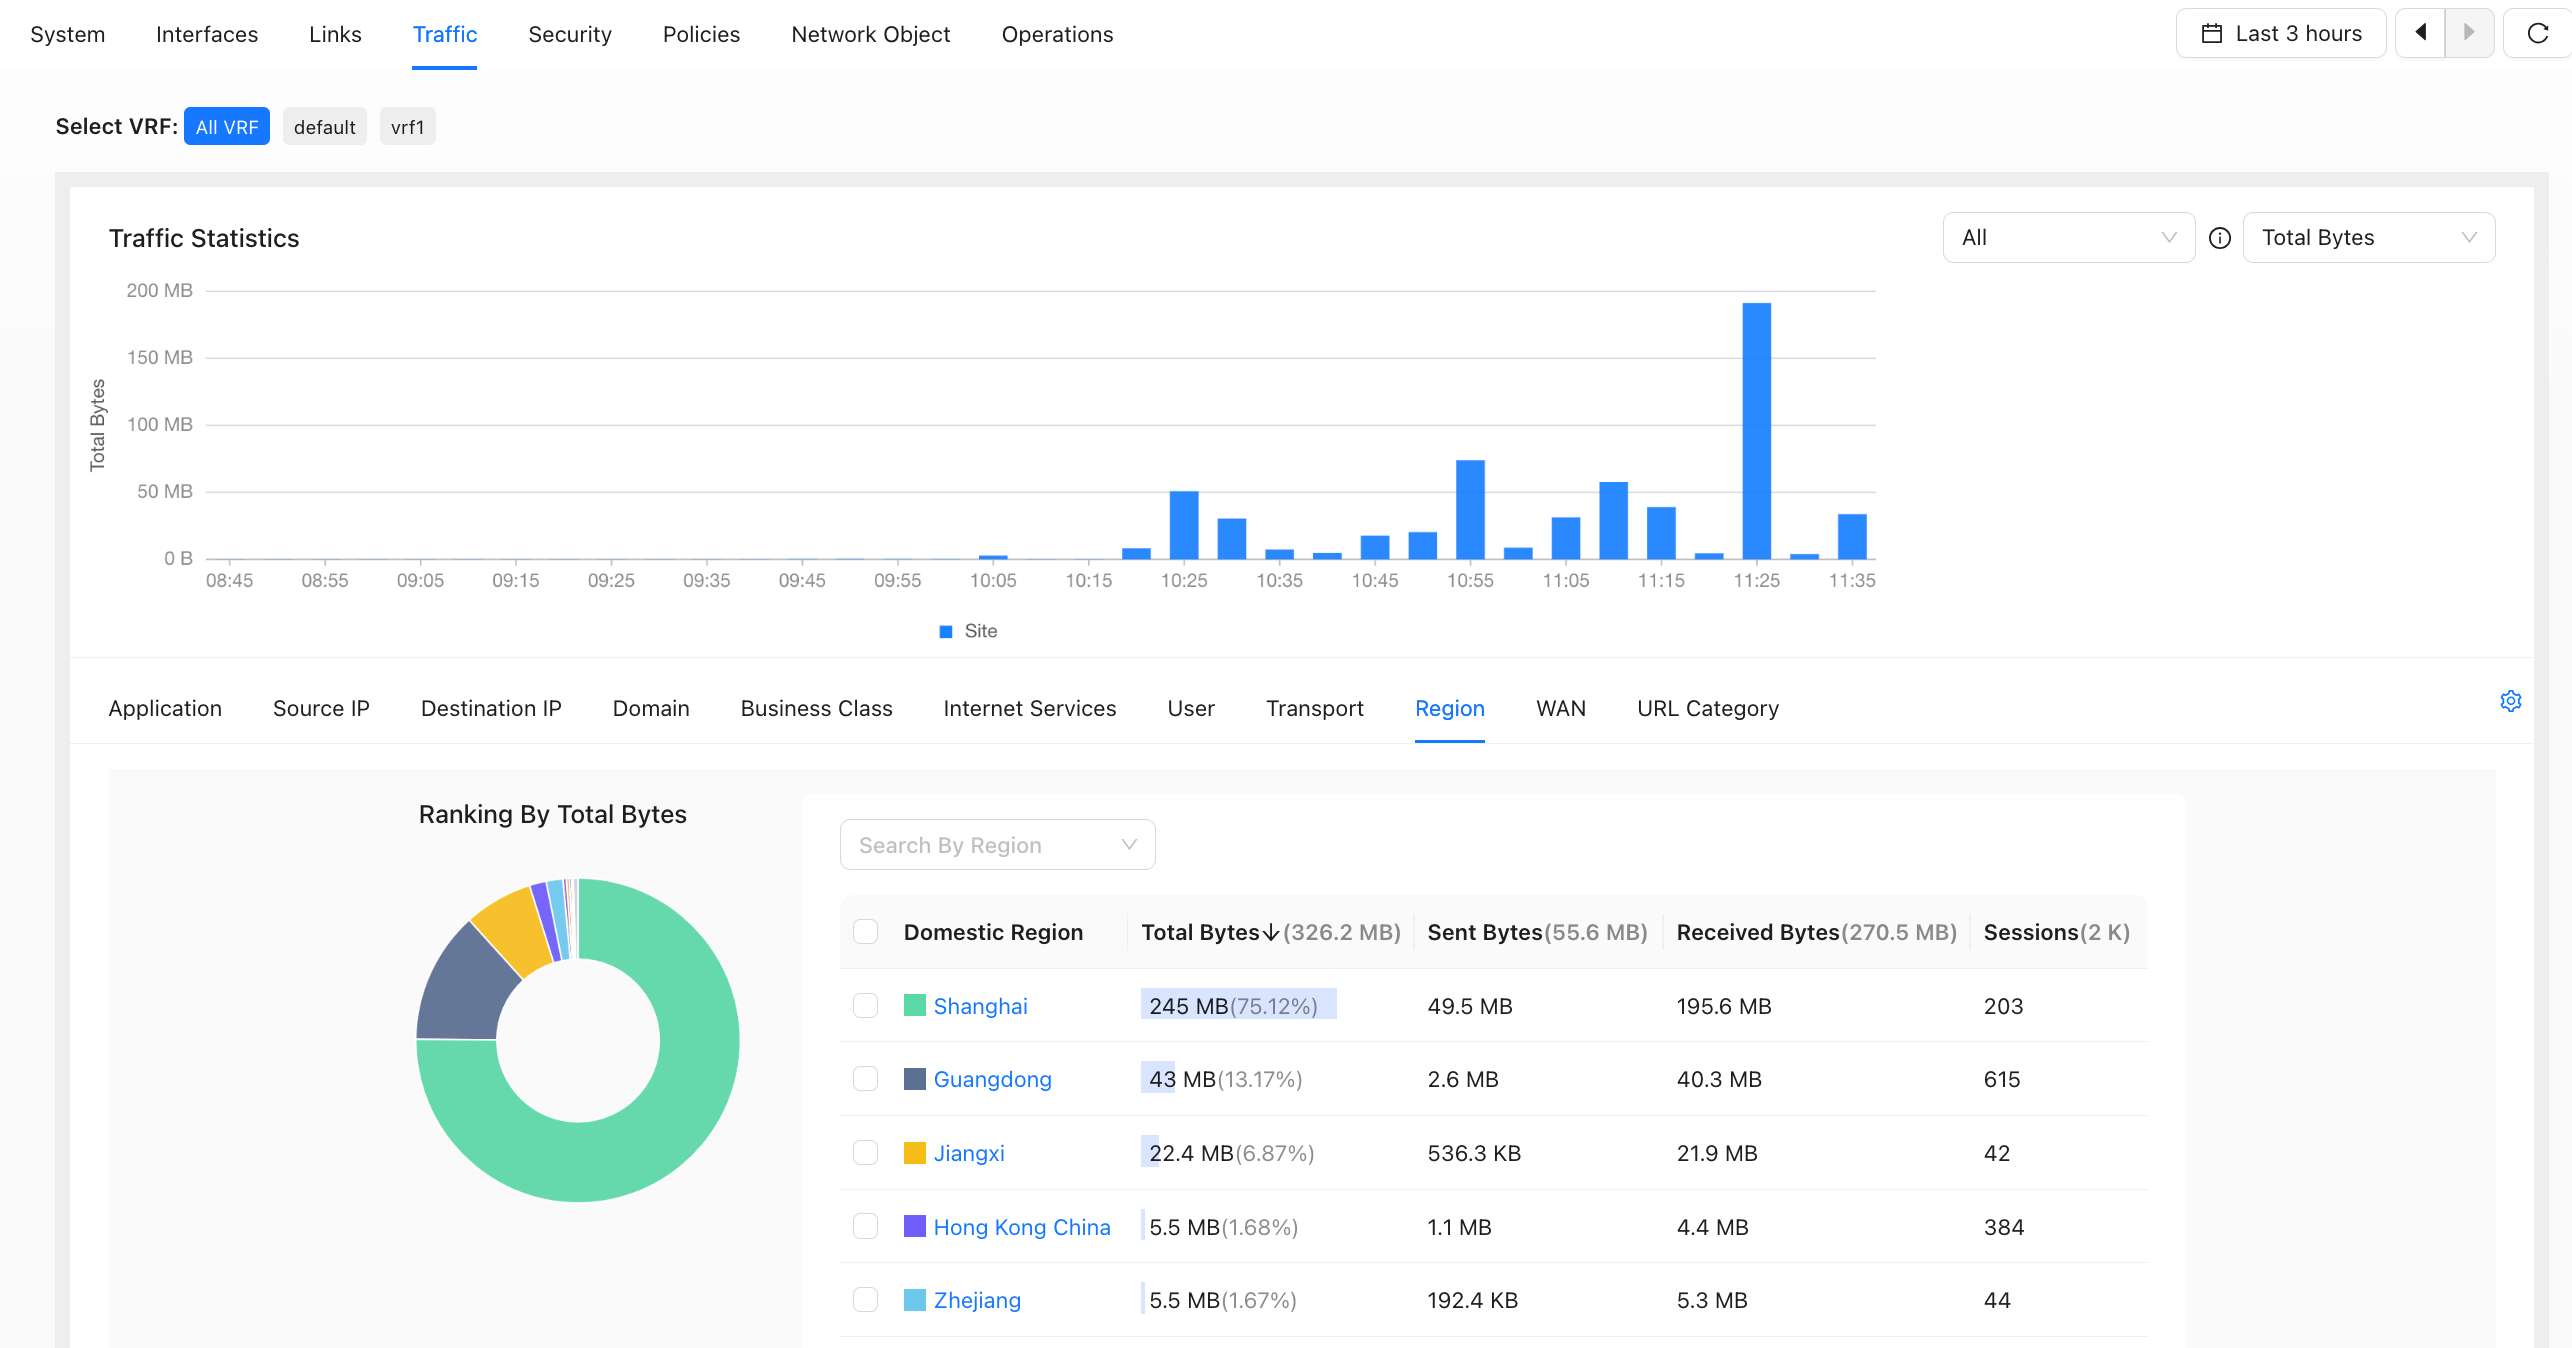
WAN
- The device version must be 6.4.0 or later.
- Includes tunnel traffic on the WAN interface and local Internet traffic.
- If the HA primary device establishes a tunnel through the standby device WAN over the heartbeat link, the traffic is counted on the standby device WAN, and vice versa.
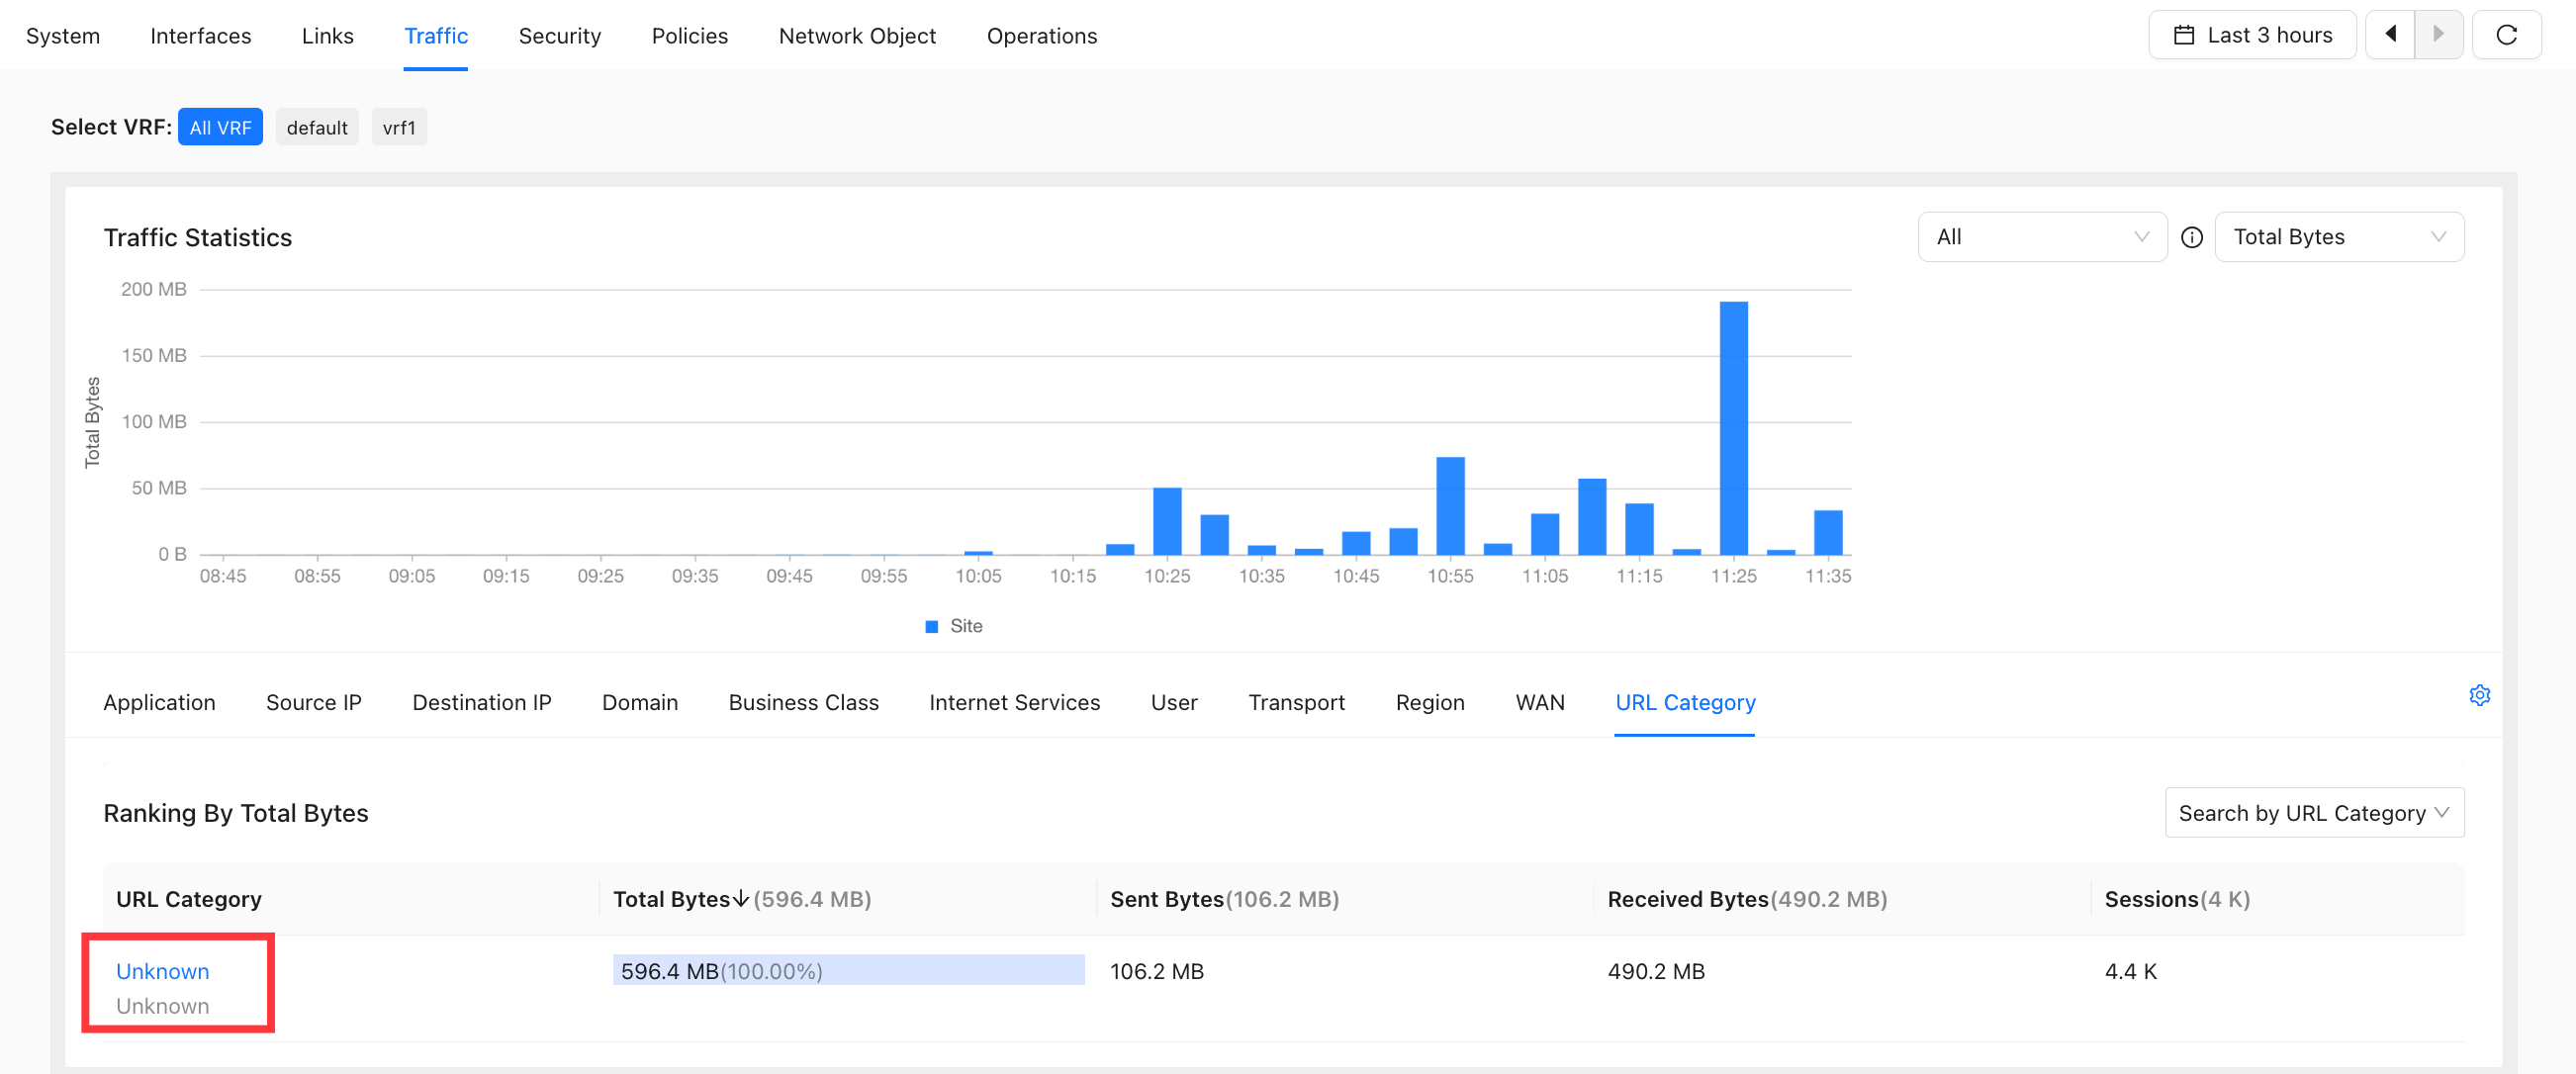
URL Category
- To identify URL categories, the device must enable SWG and configure URL filtering in the Security Service policy. Otherwise, URL categories are displayed as "Unknown".
Path: Site Detail → Traffic → URL Category, as shown below.
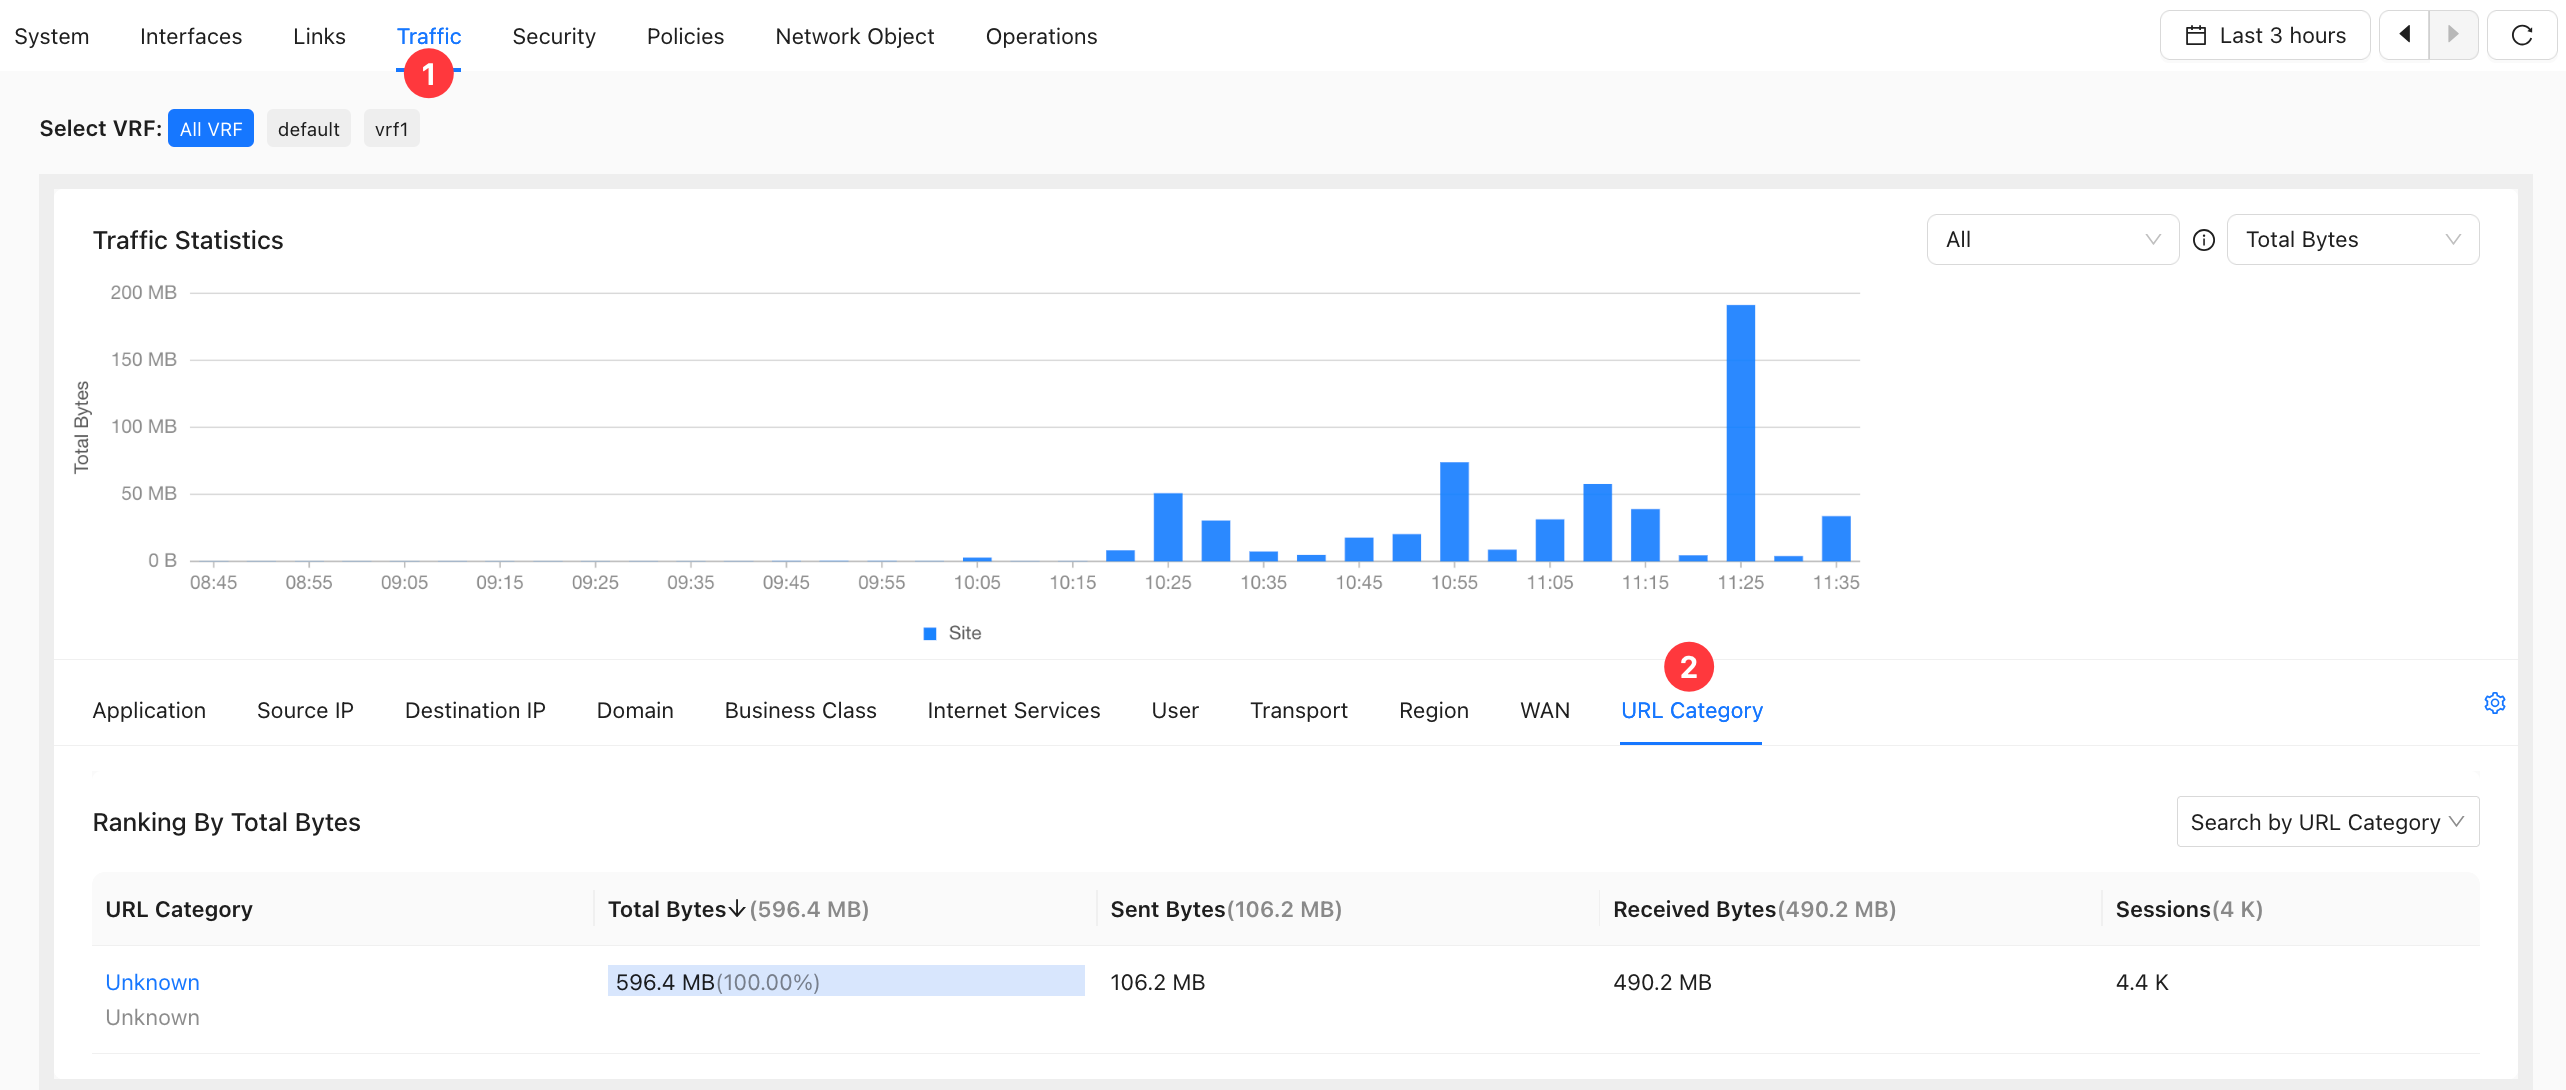
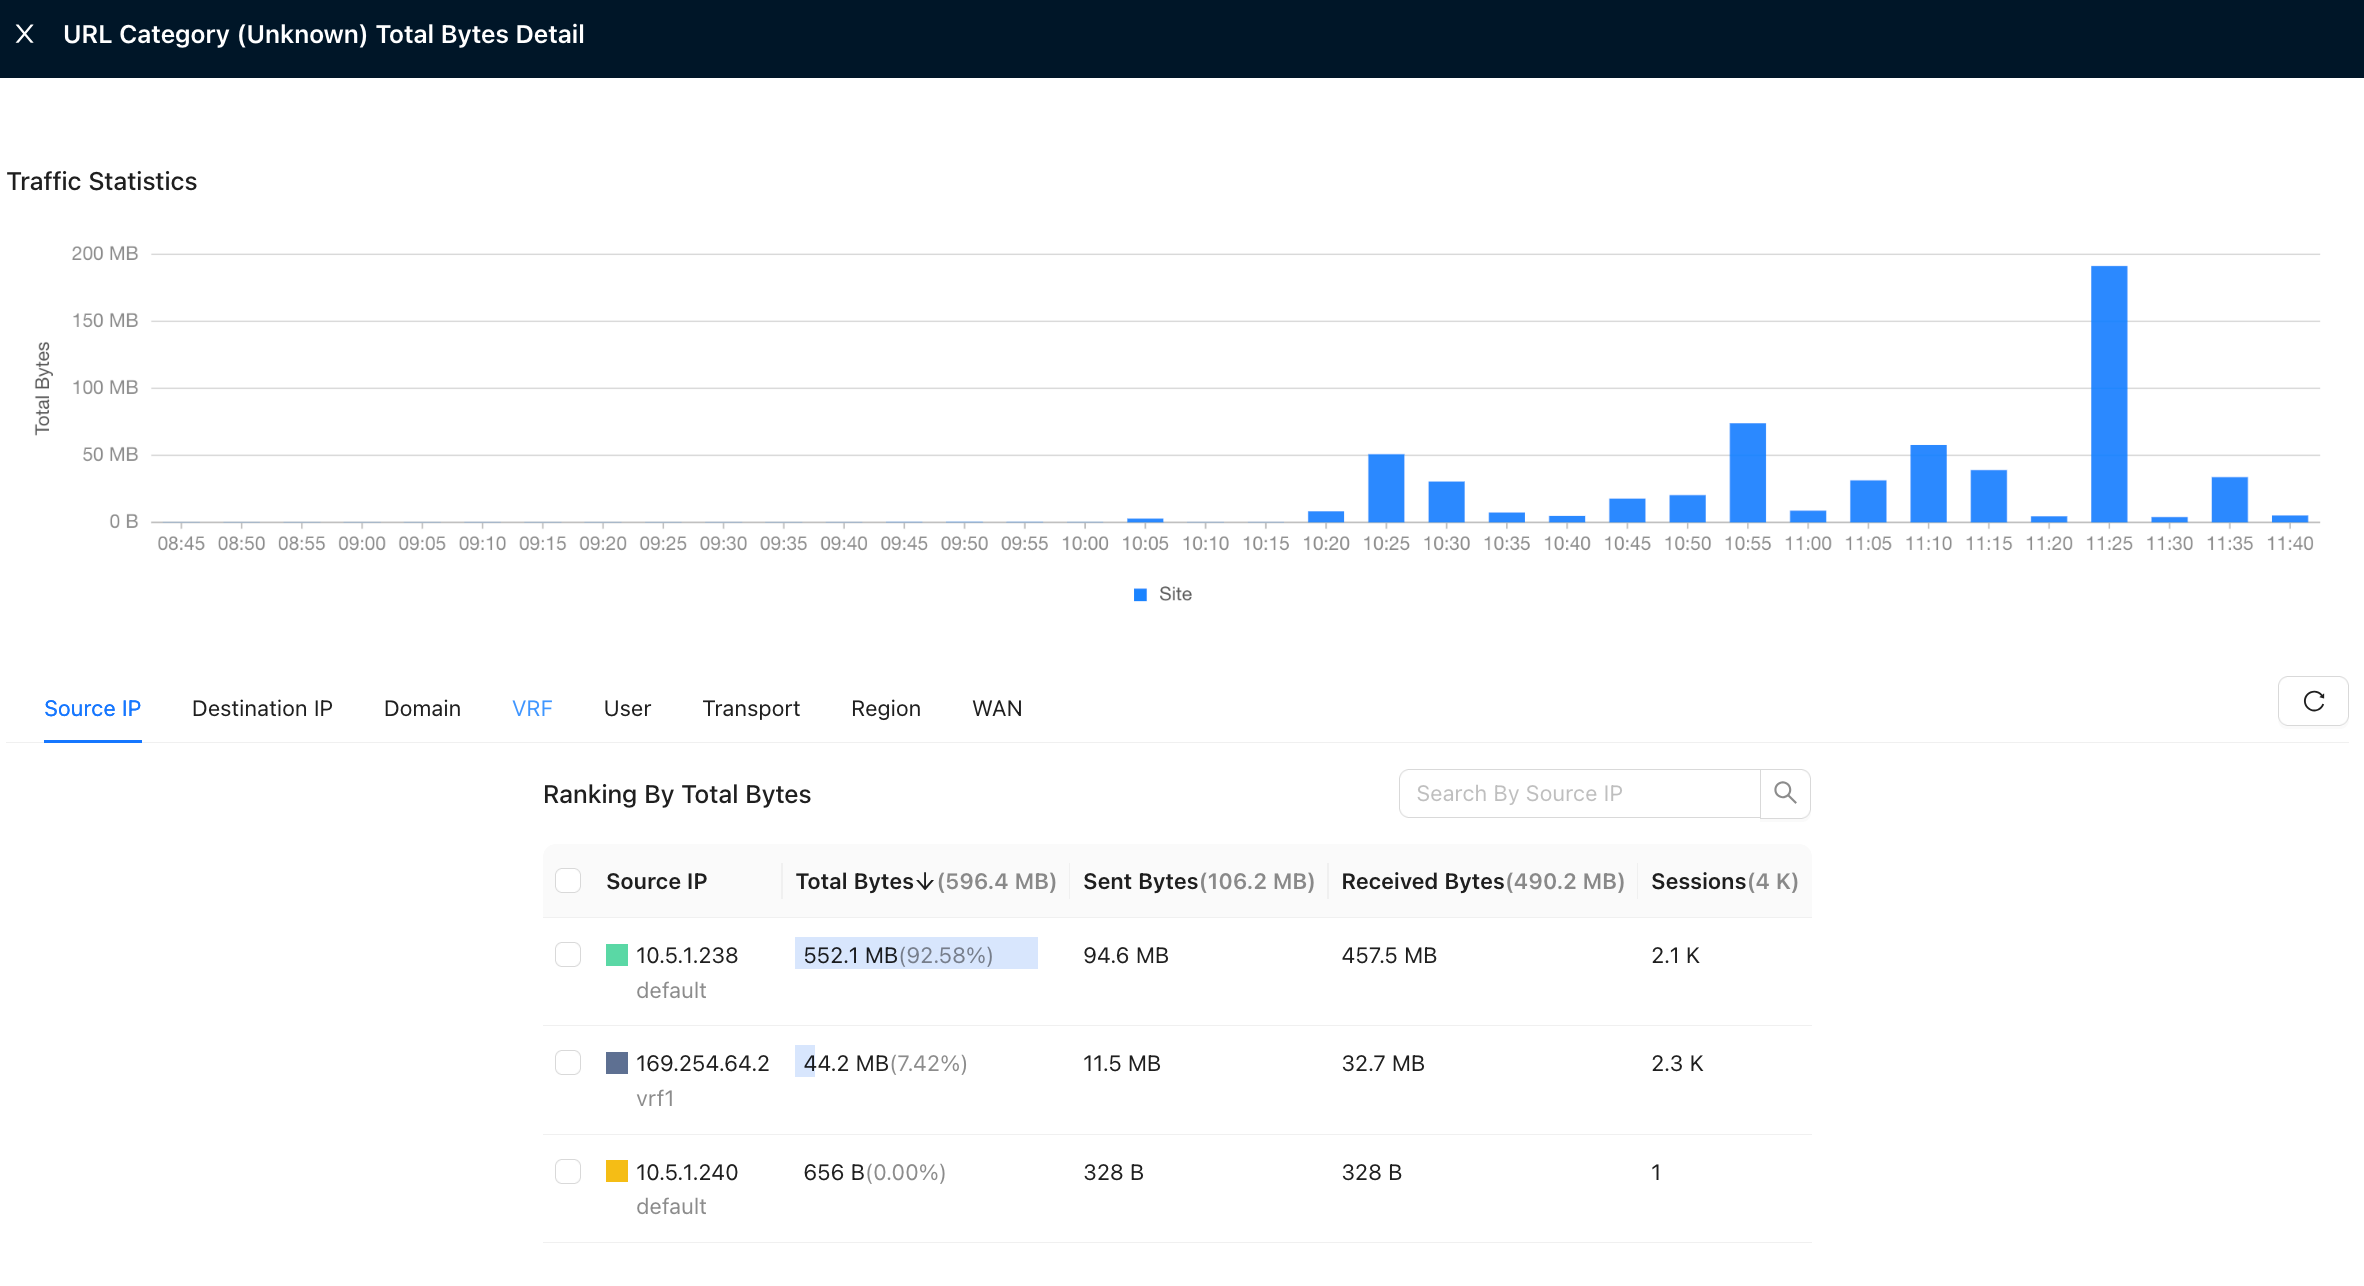
Click the URL Category icon to open the details page.
Security
- View site security statistics. The maximum query range is the last 7 days.
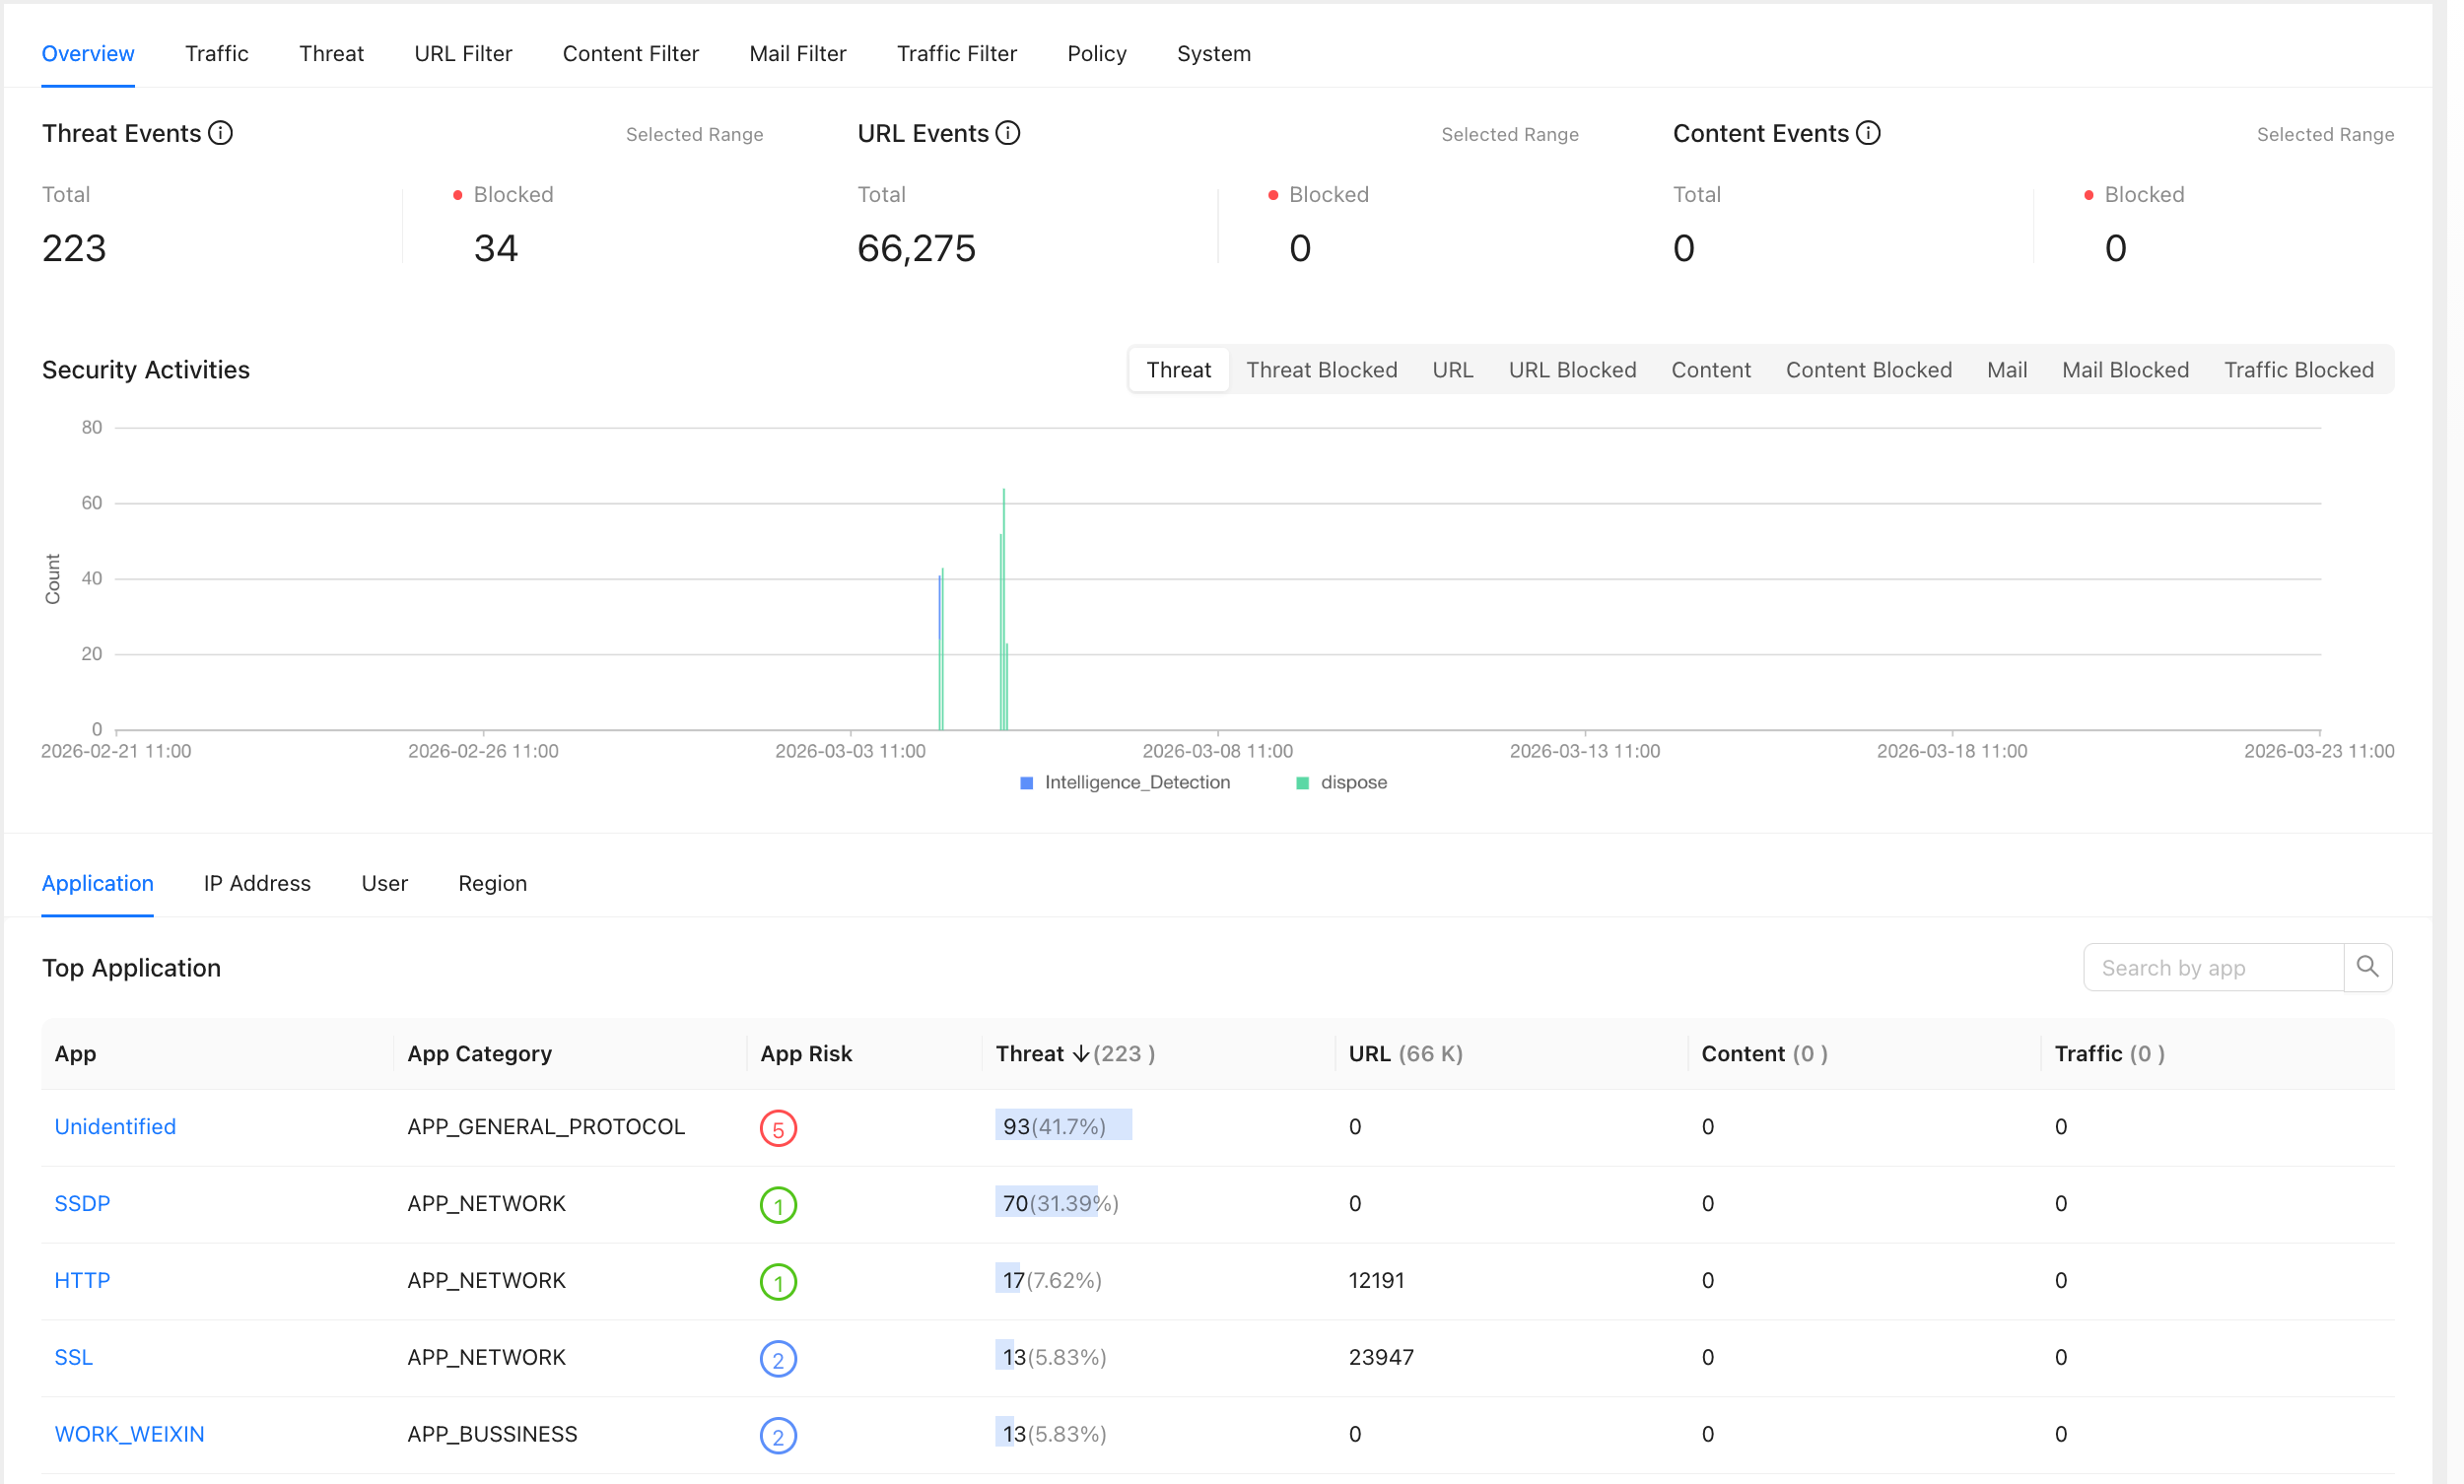
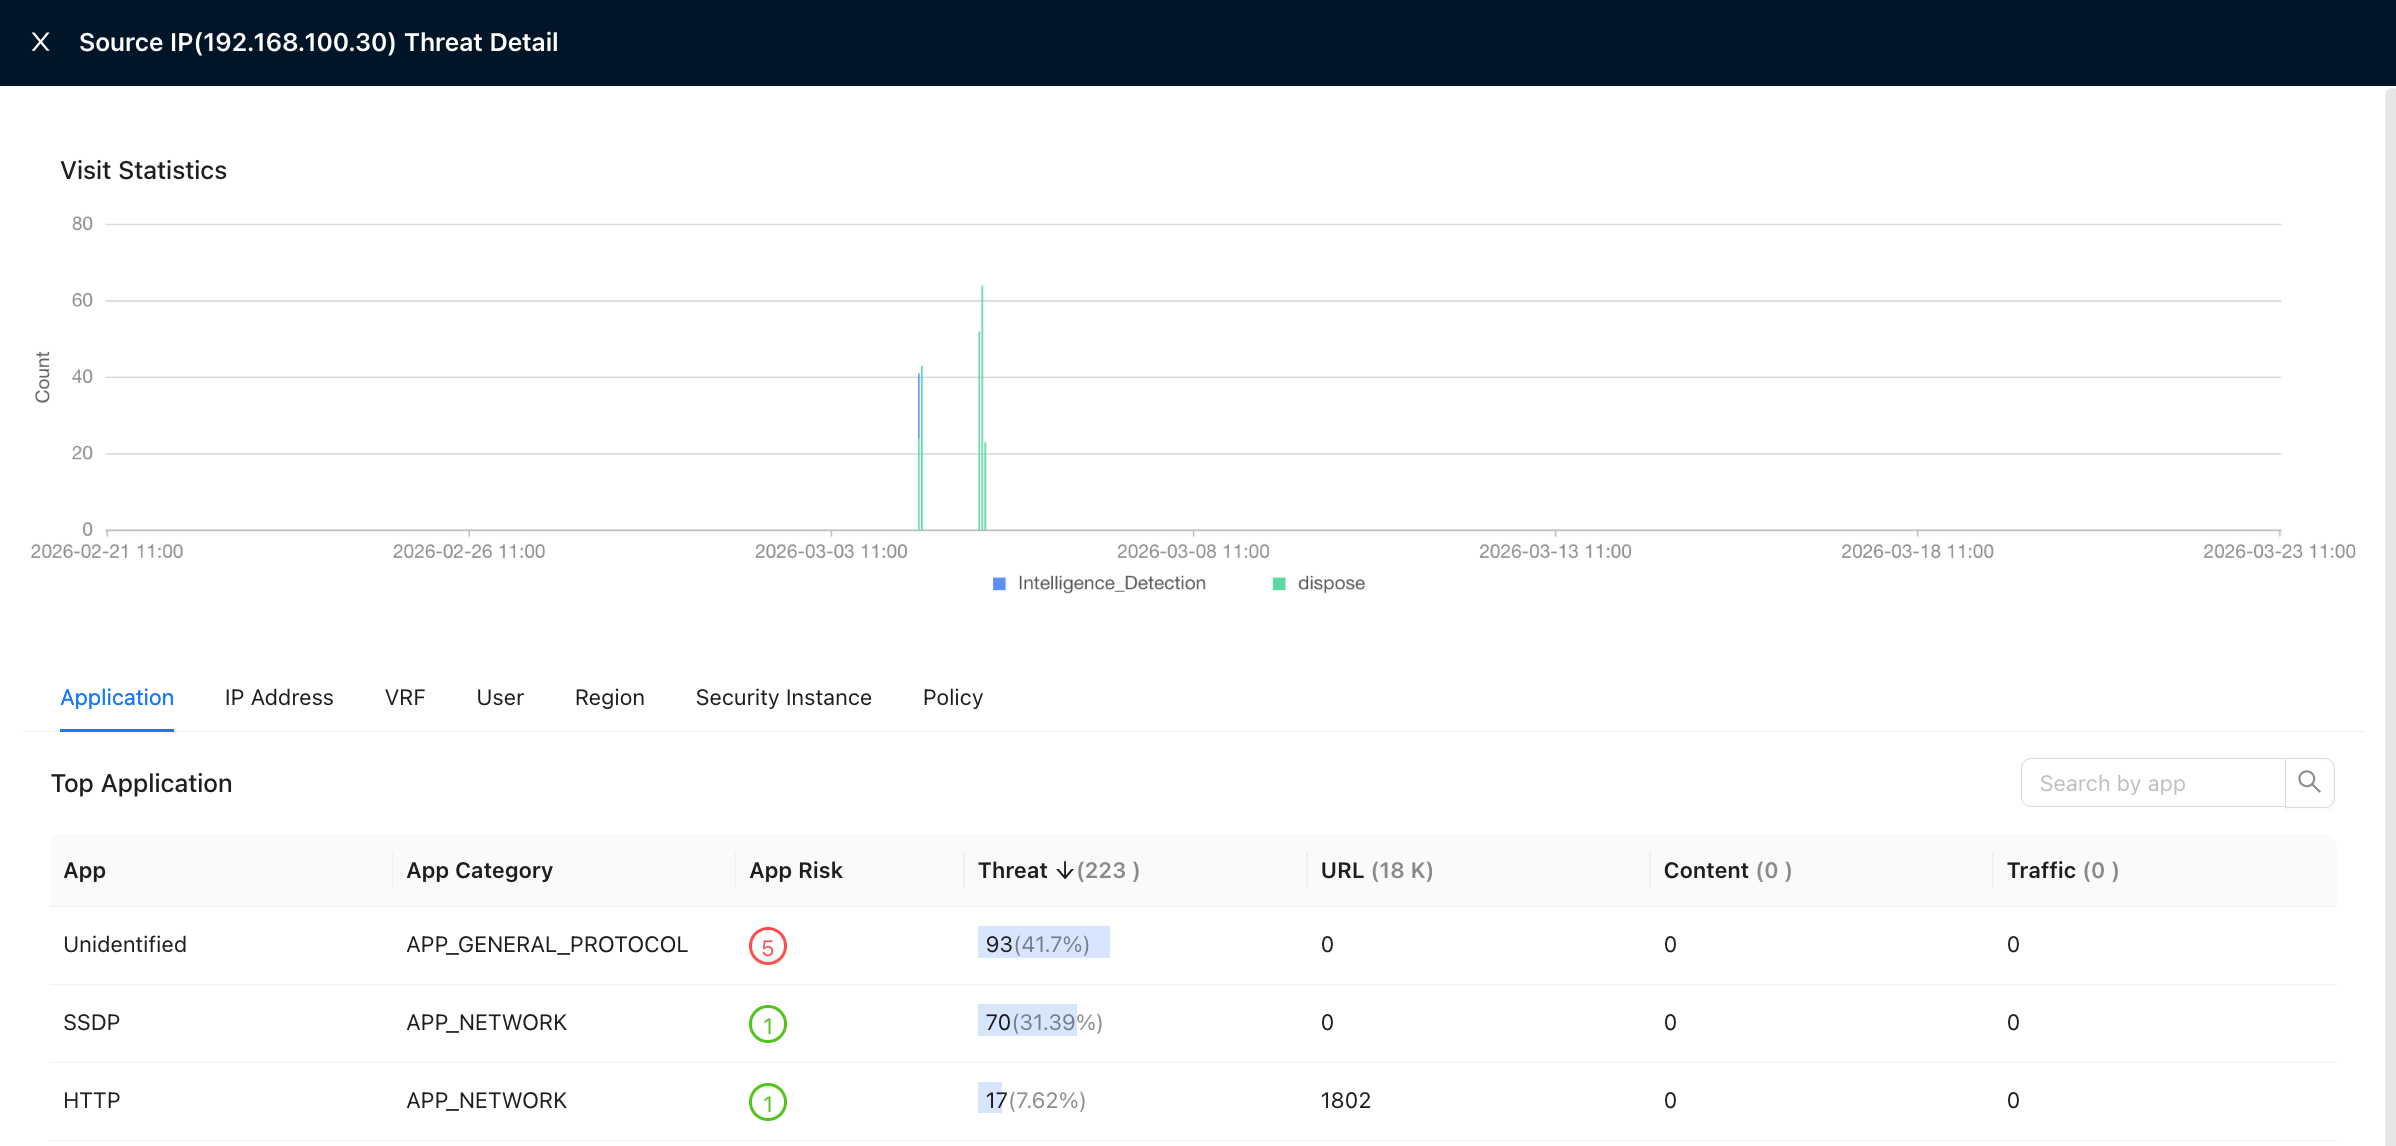
Source
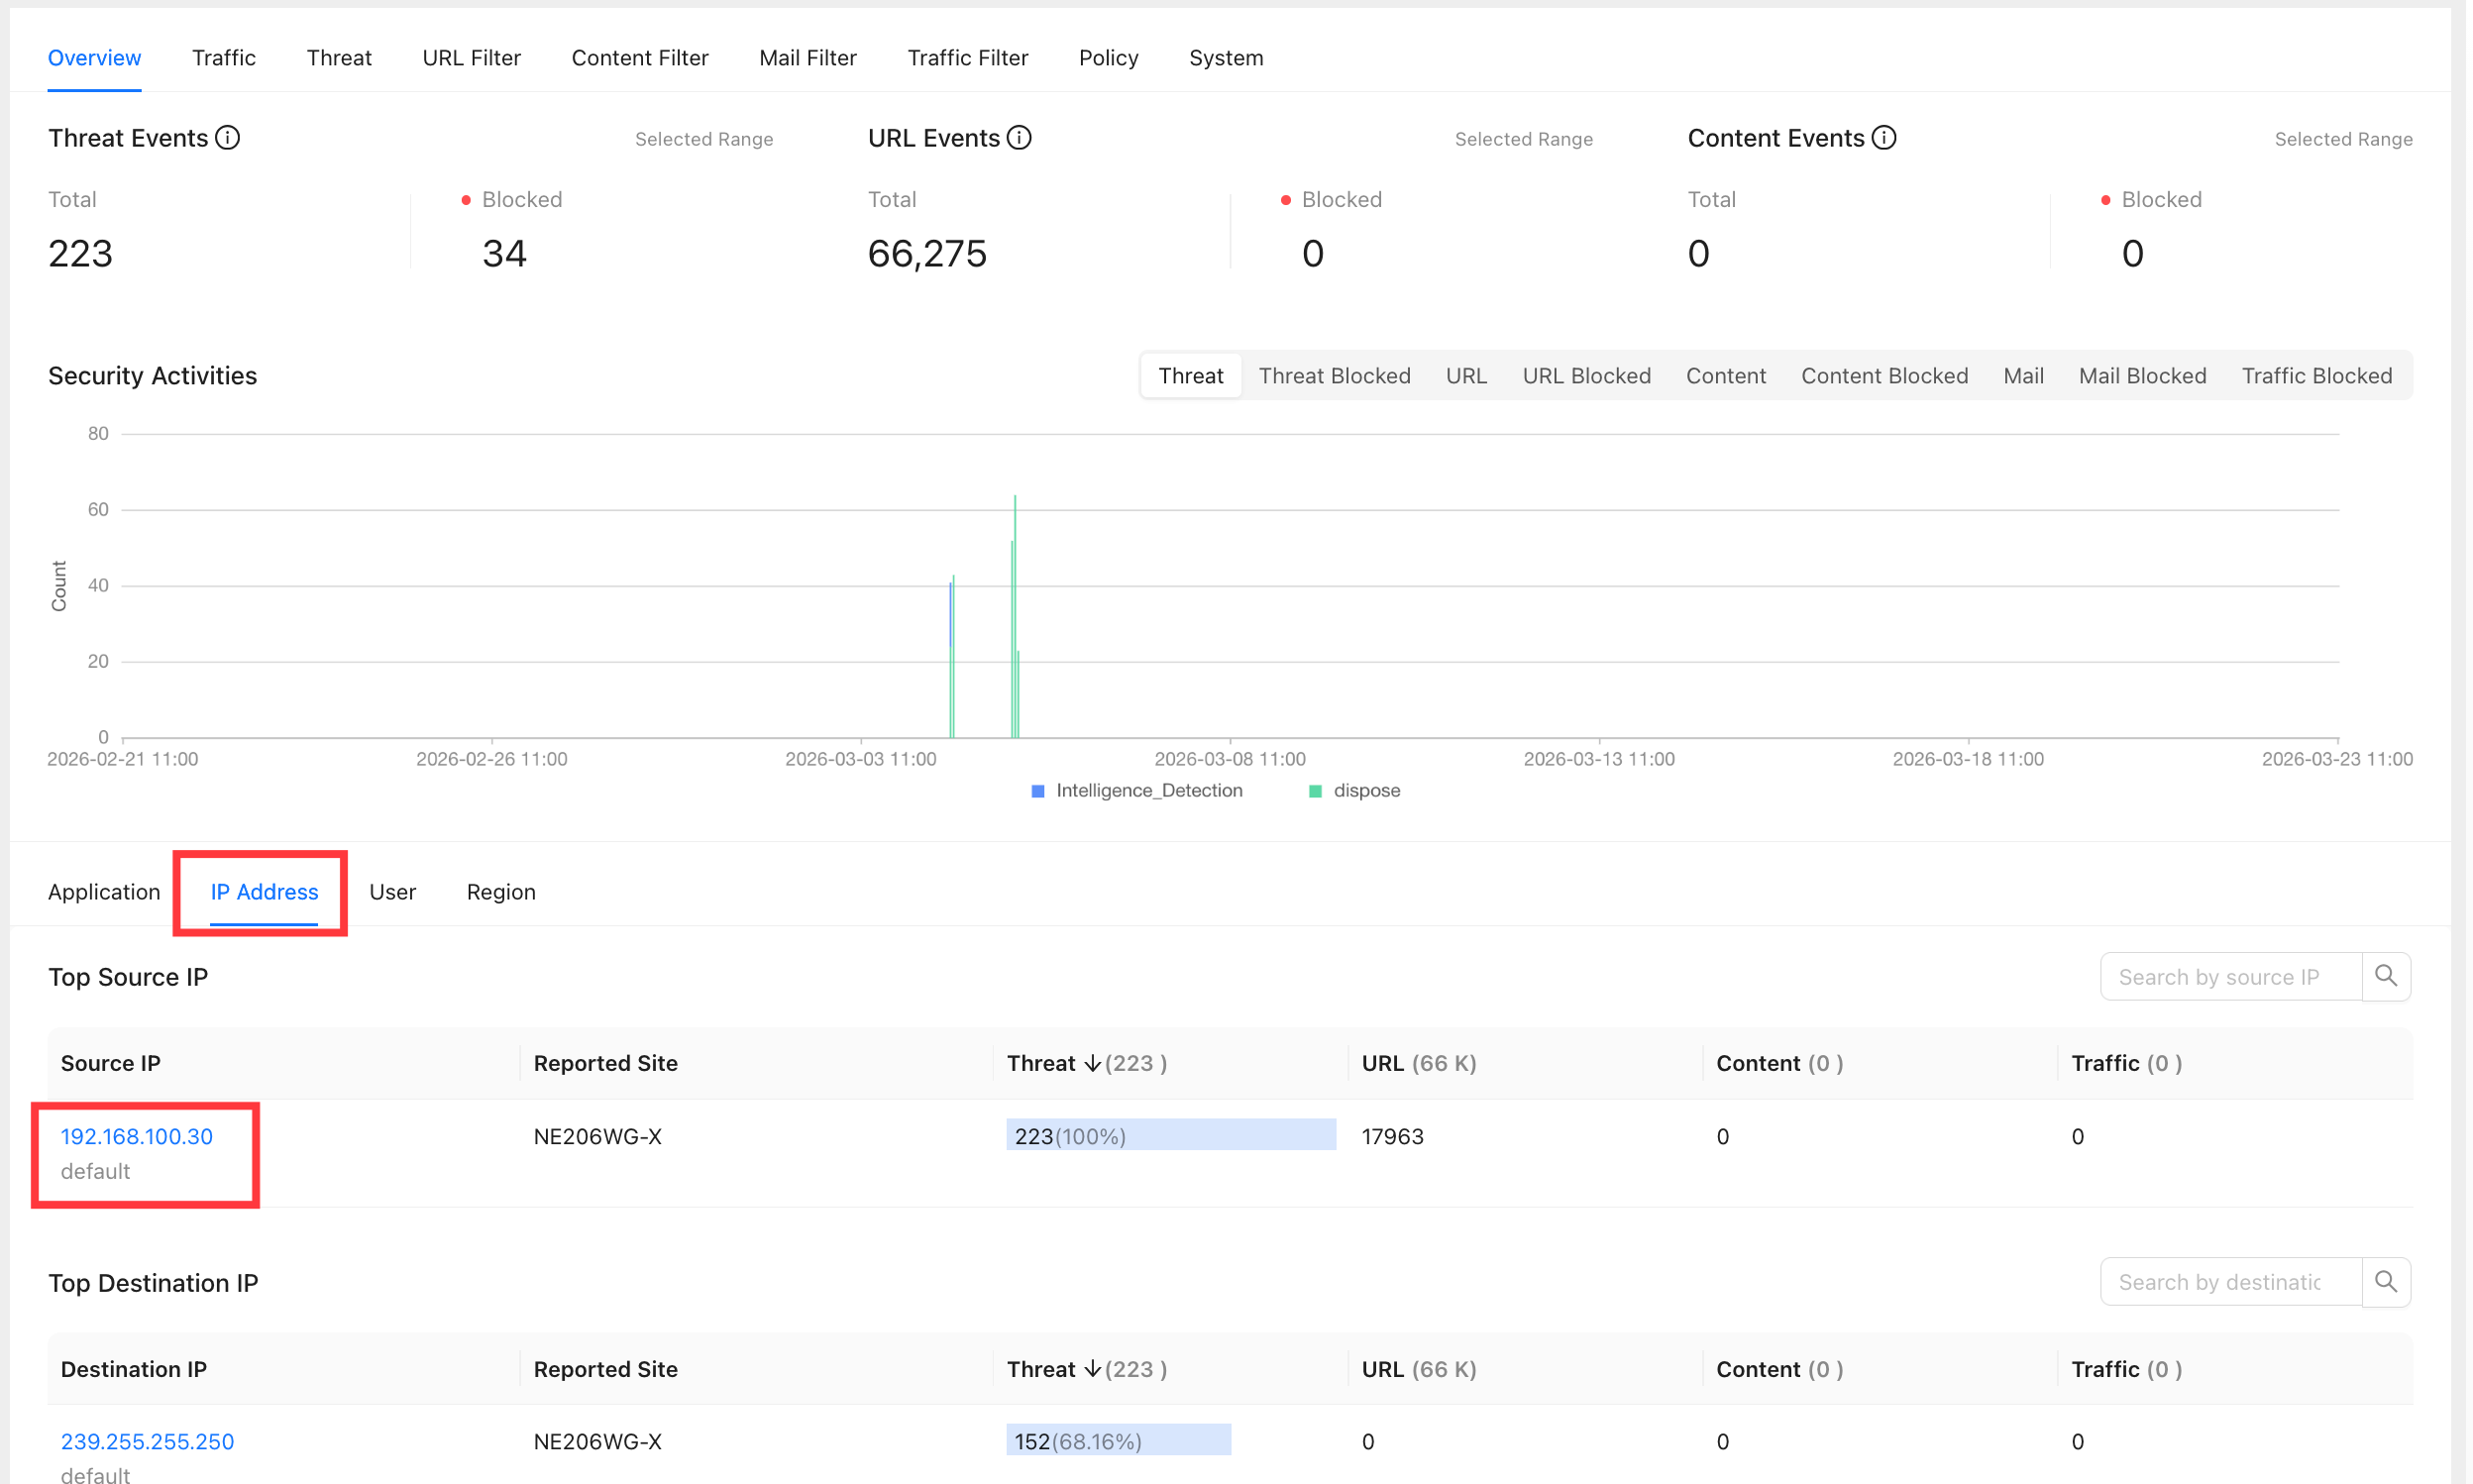
You can view the destination IP addresses accessed by the source IP address.
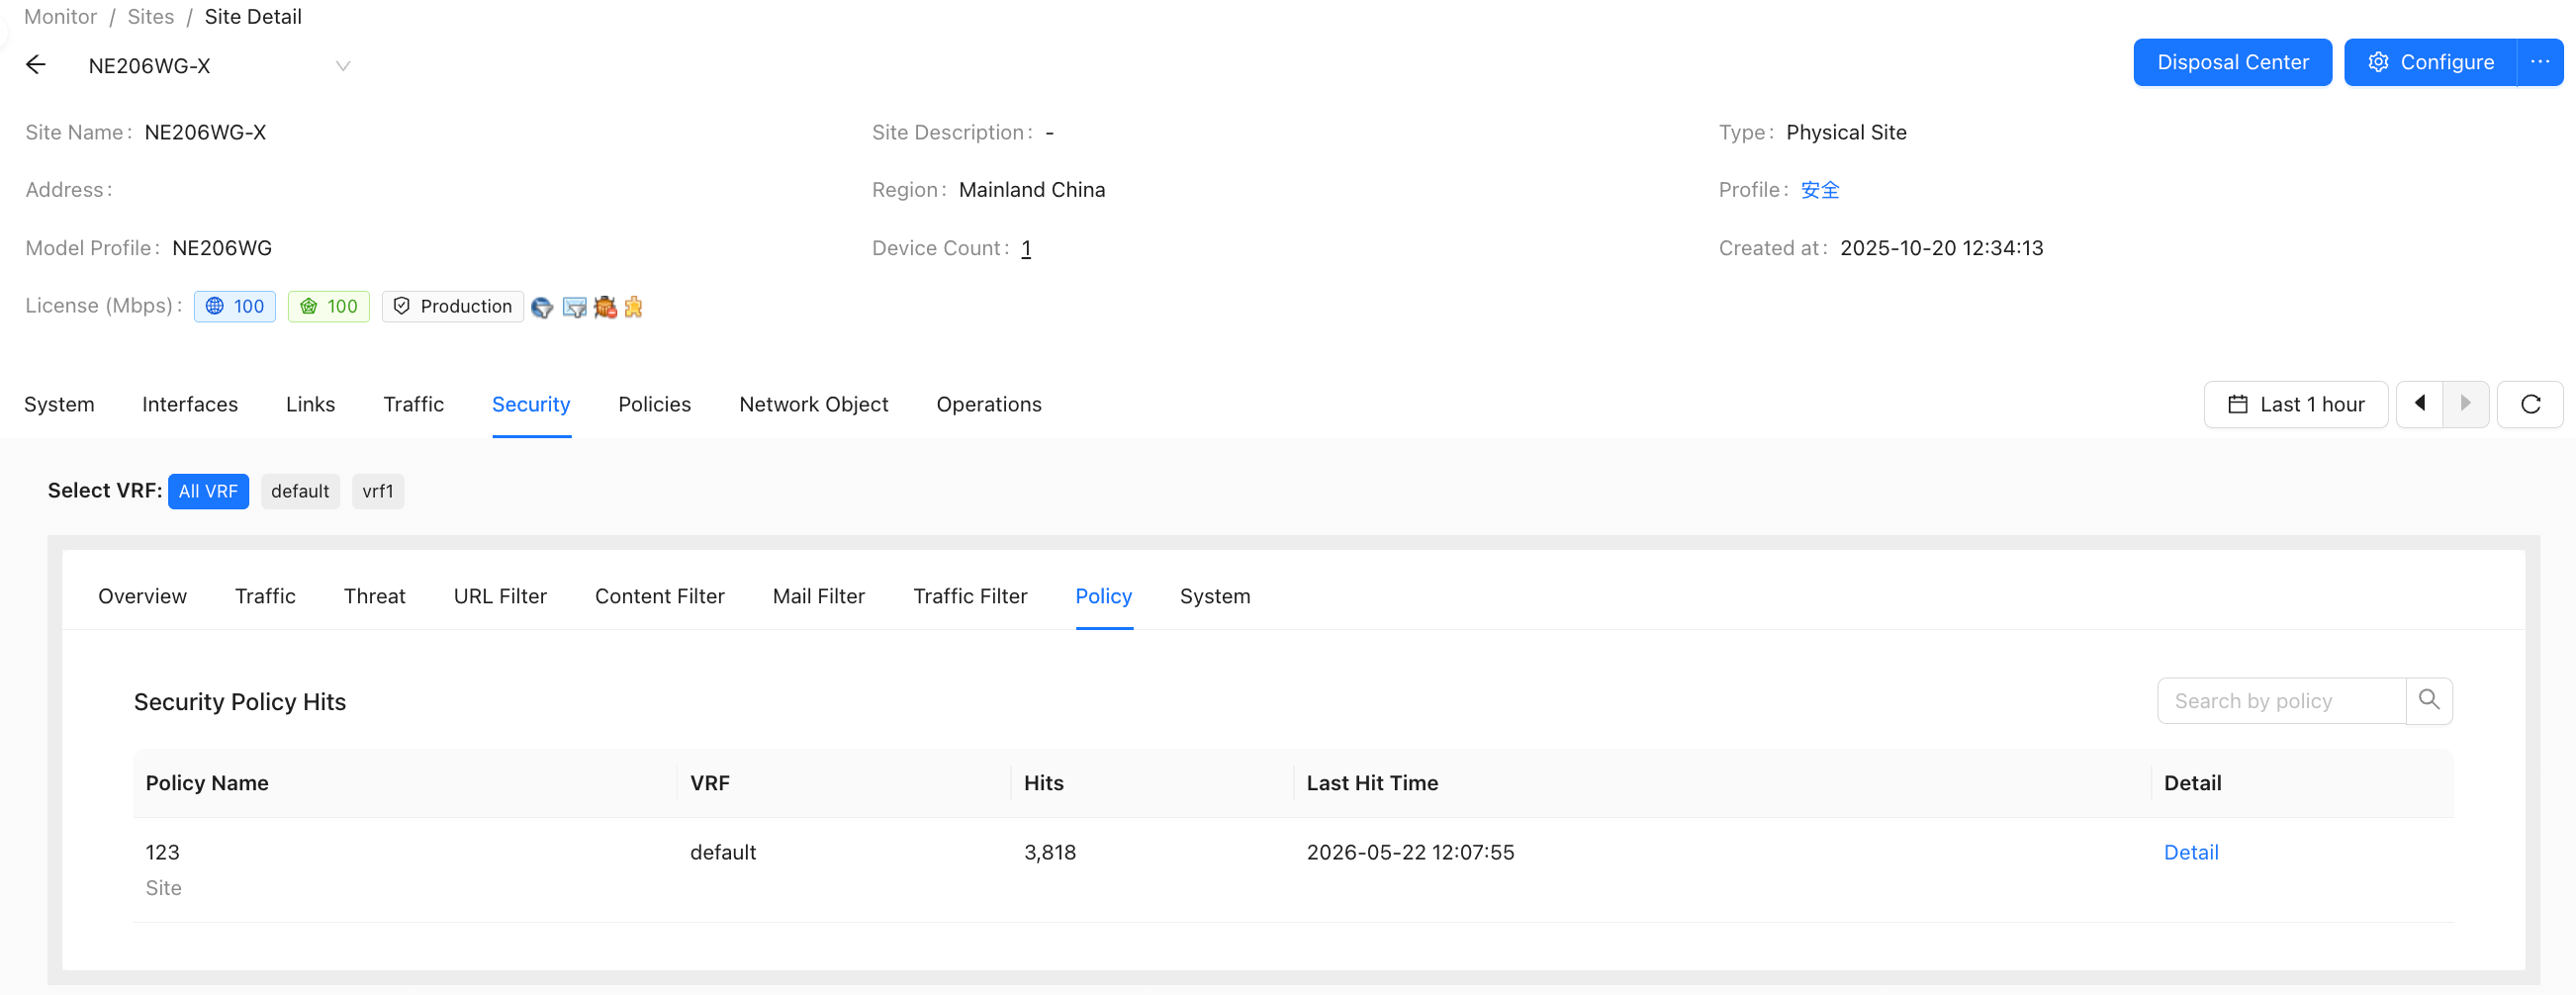
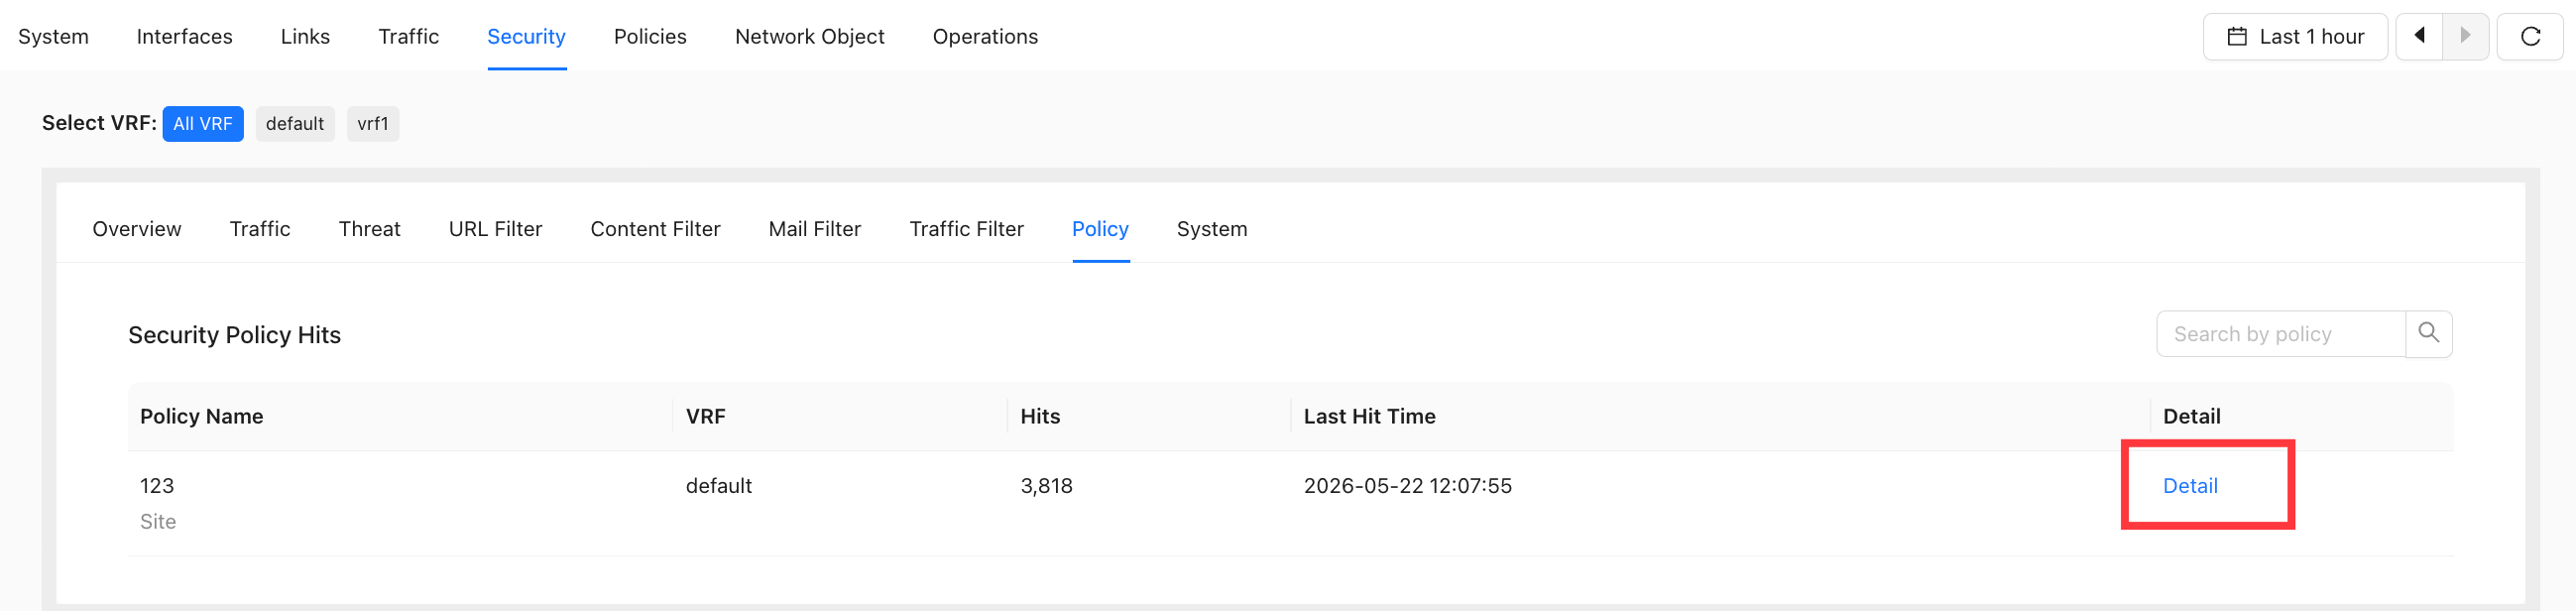
Policy
Security policy hits.
- The device version must be 6.4.0 or later.
- Function: Query historical security policy hit counts.
Filter by time range and VRF to view the security policy hit count and last hit time within the selected range.
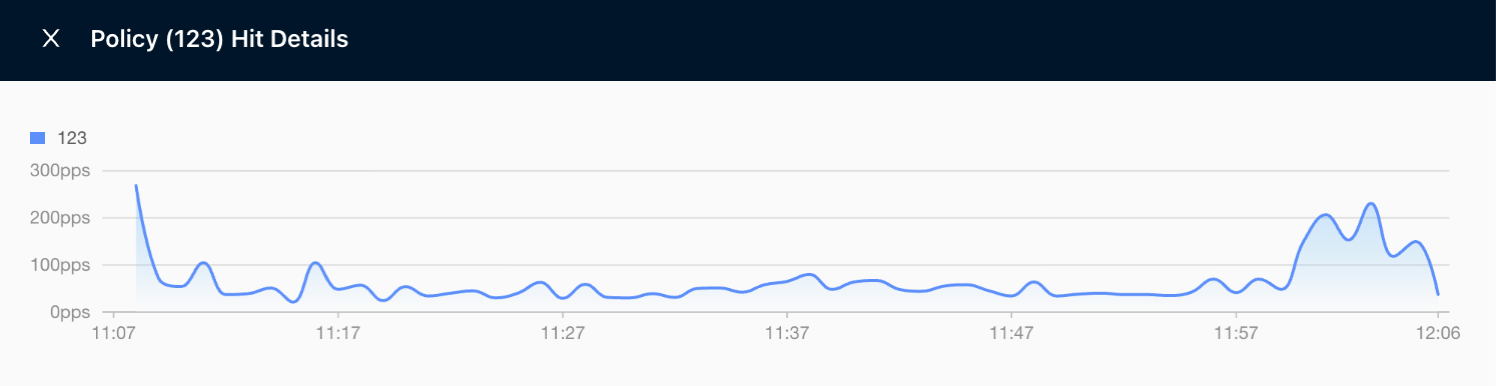
Click "Details" to view the hit count at each time point within the selected range.
Policies
- View monitoring statistics related to site policies.
Business Policy
Business Policy Packet Loss Query
- Supported on device version 6.4.0 or later.
- Query packet loss caused by business policy QoS rate limiting.
- Packet loss statistics
Path: Site Detail → Policies → Business Policy
- Packet loss statistics within the selected time range.
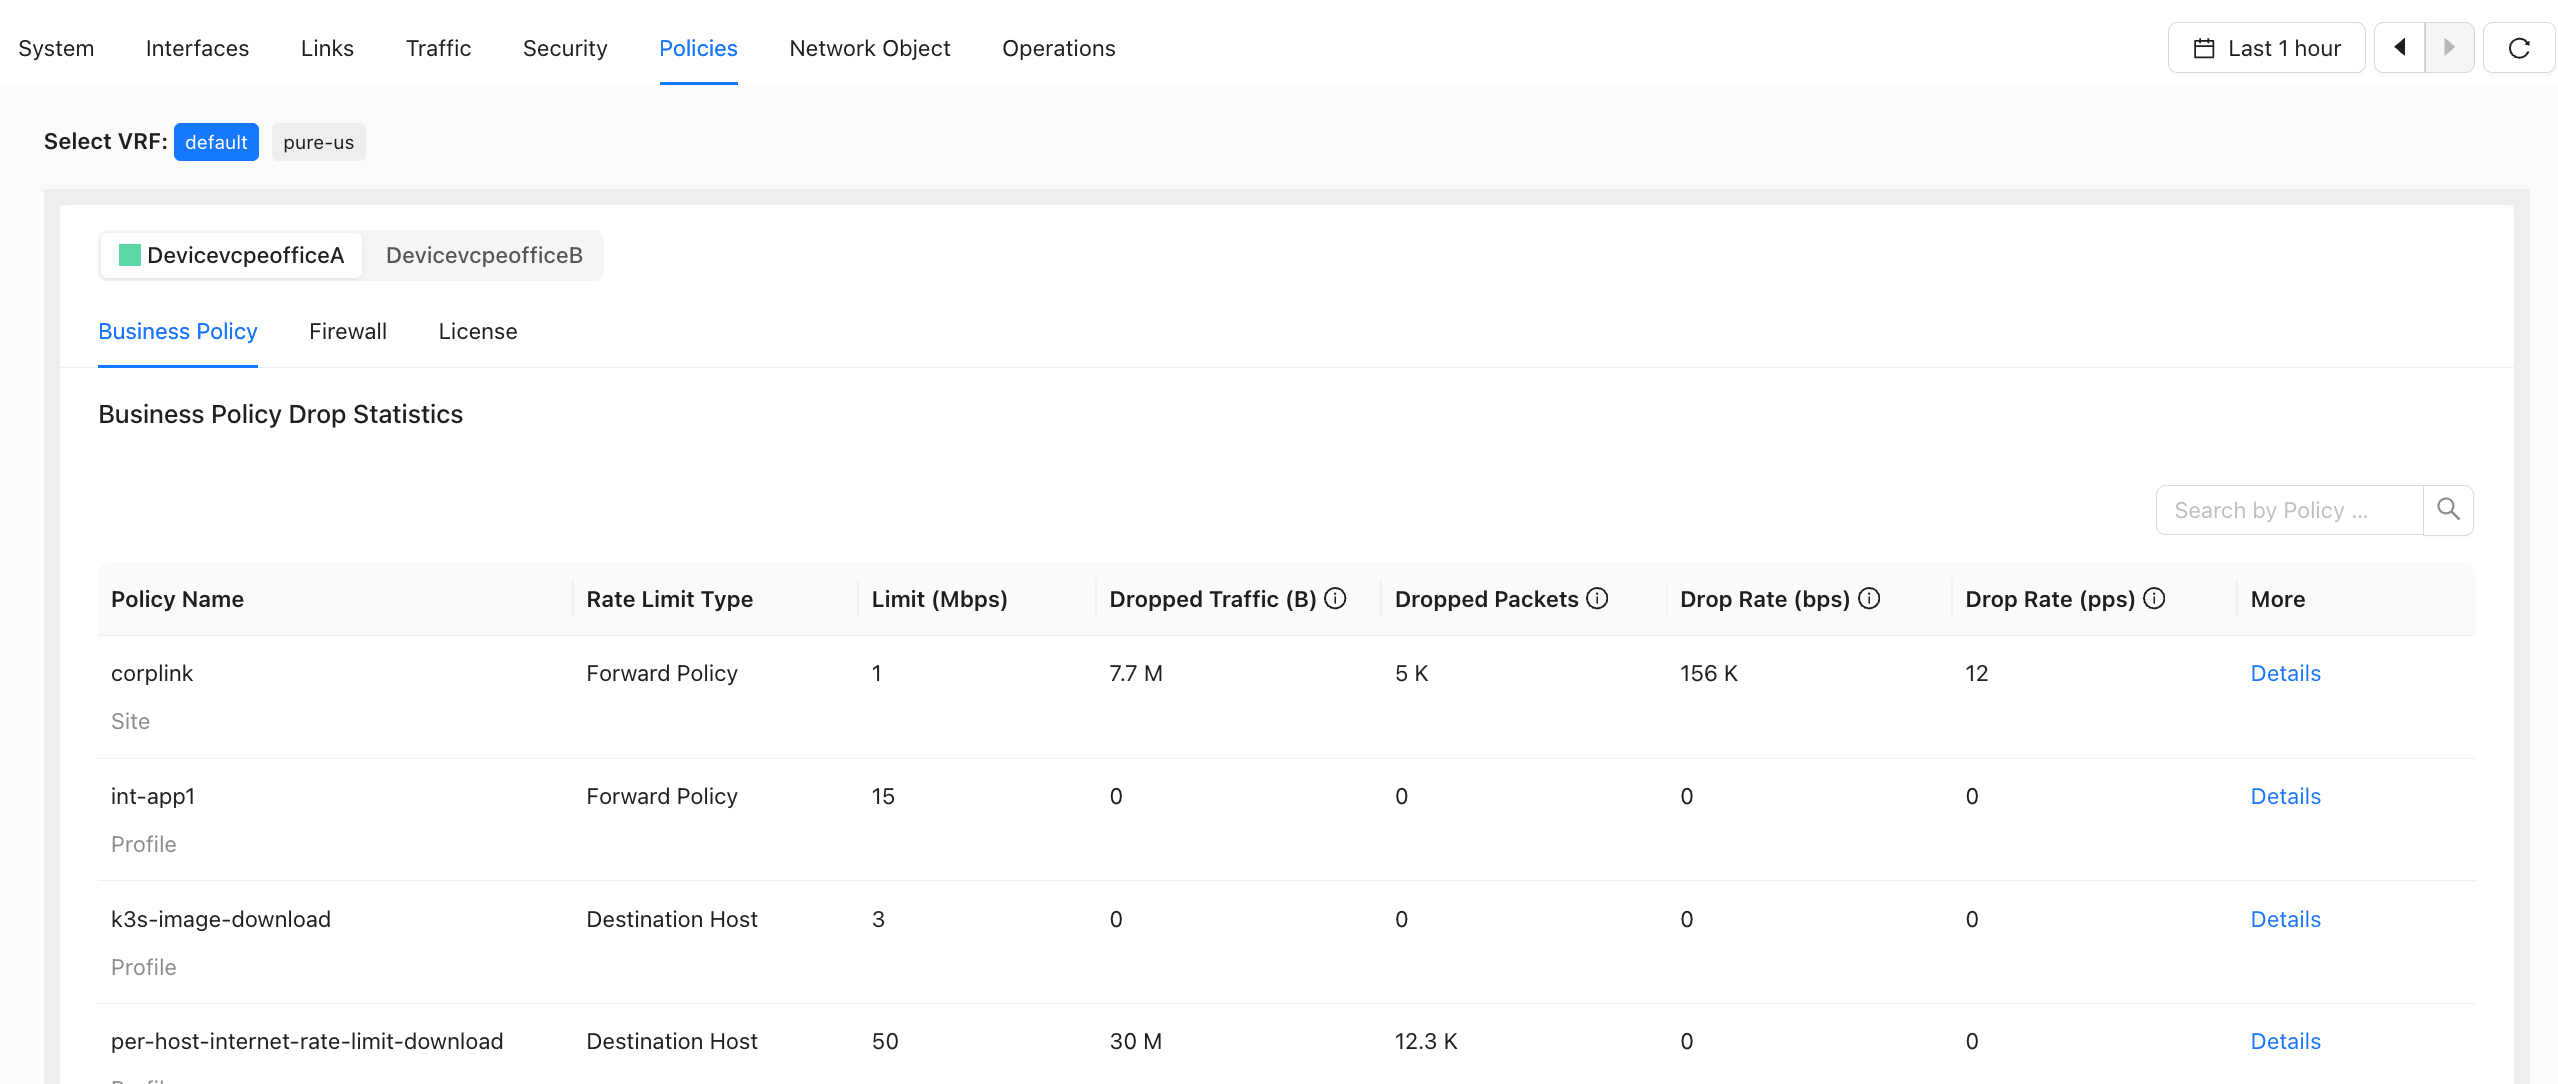
- Parameter Description
| Parameters | Description |
|---|---|
| Policy Name | Business policy rule name |
| Rate Limit Type | QoS rate limit type |
| Current Rate Limit (Mbps) | Currently configured QoS rate limit value |
| Dropped Traffic (B) | Dropped traffic within the specified time range |
| Dropped Packets | Number of dropped packets within the specified time range |
| Packet Loss Rate (bps) | Packet loss rate within the current 5-minute interval (bps) |
| Packet Loss Rate (pps) | Packet loss rate within the current 5-minute interval (pps) |
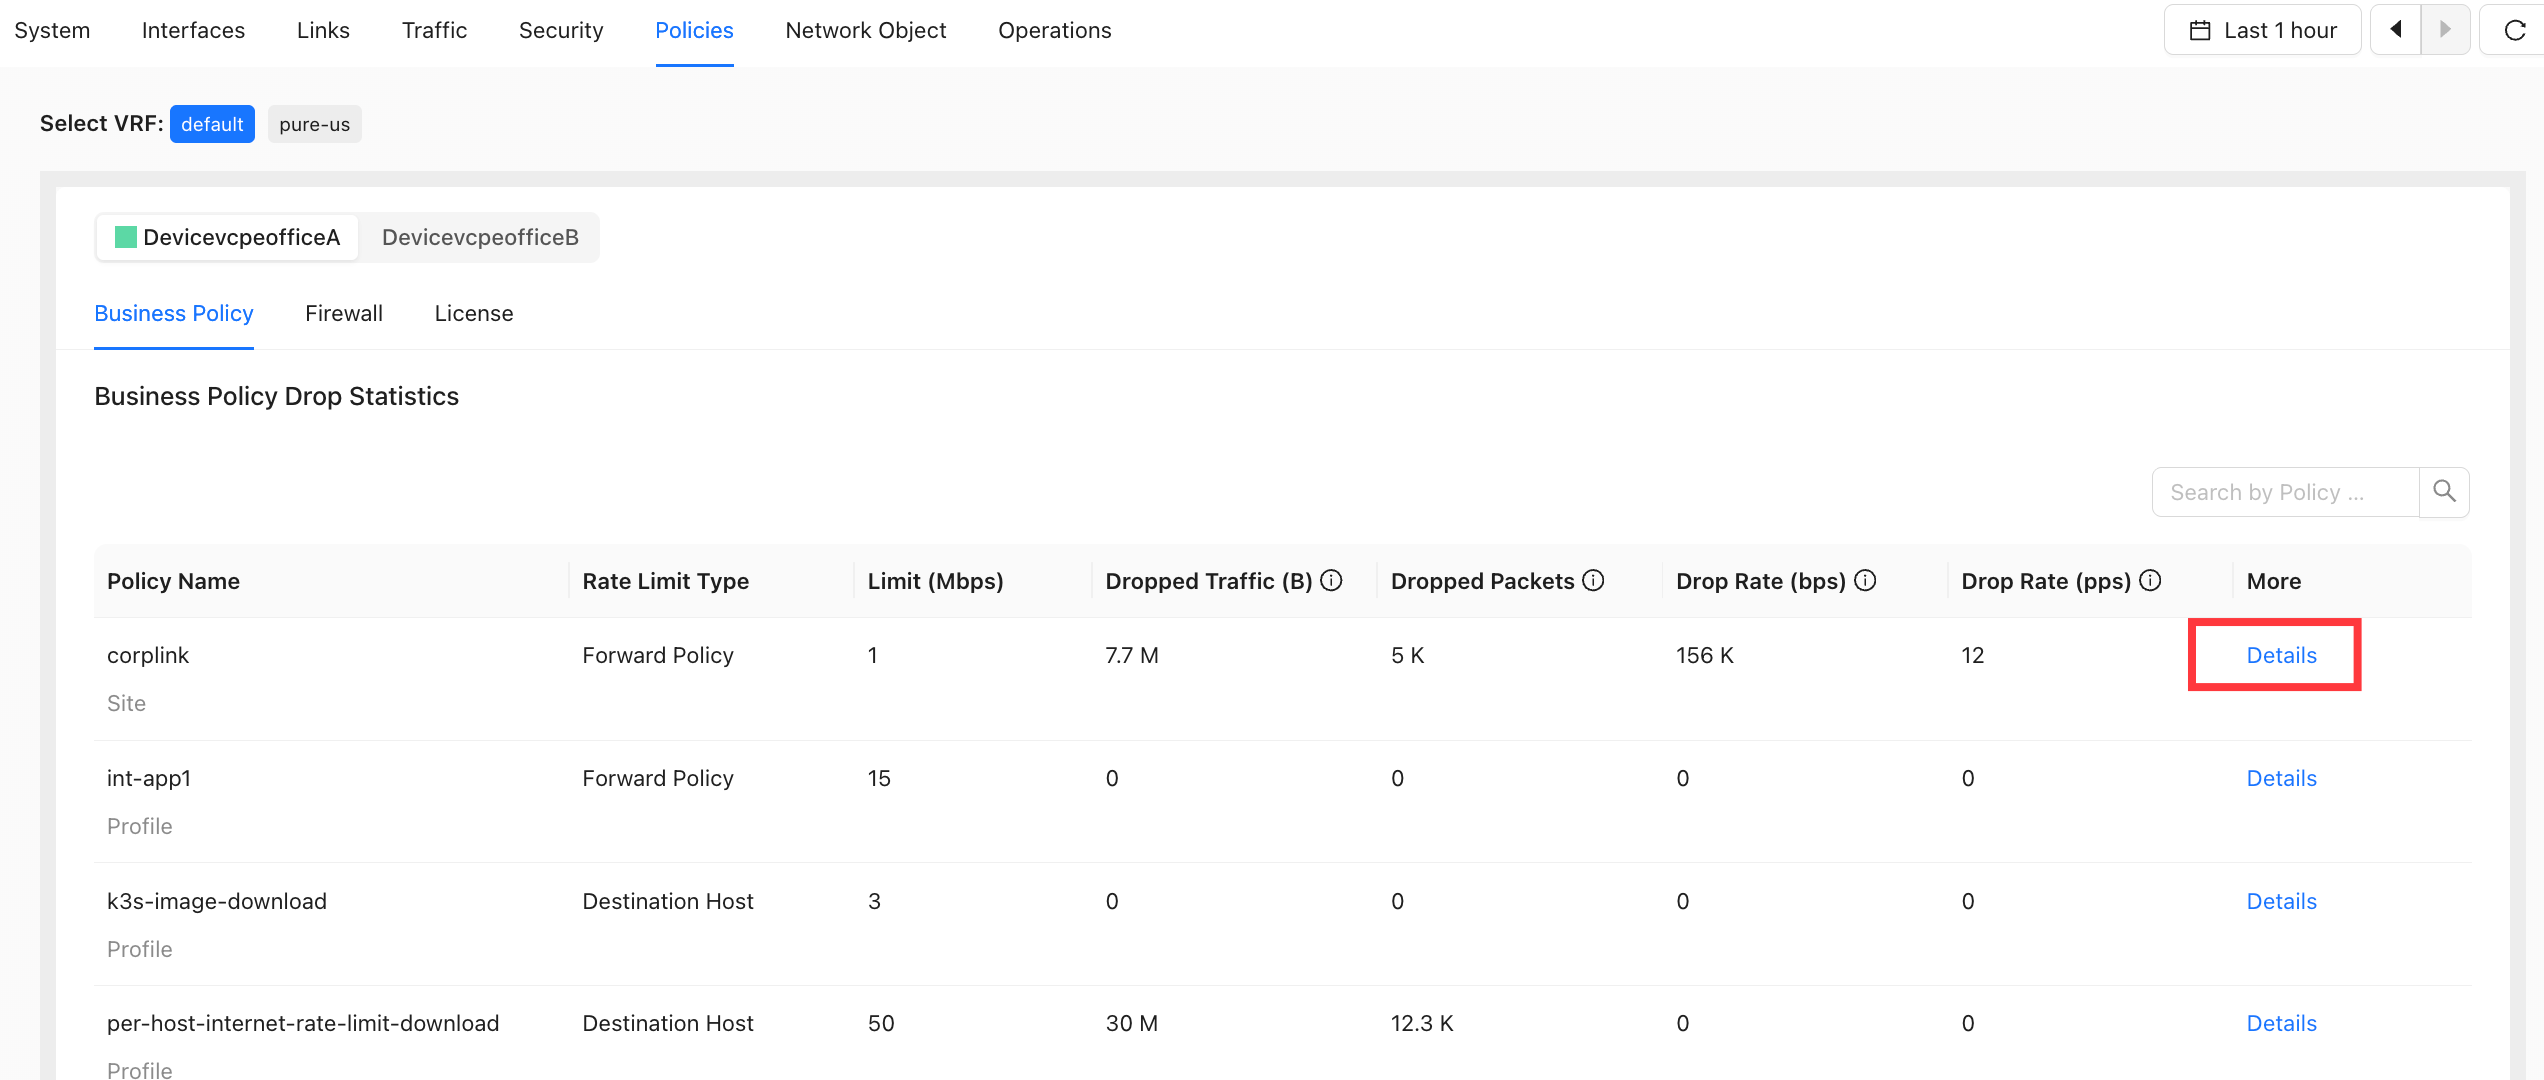
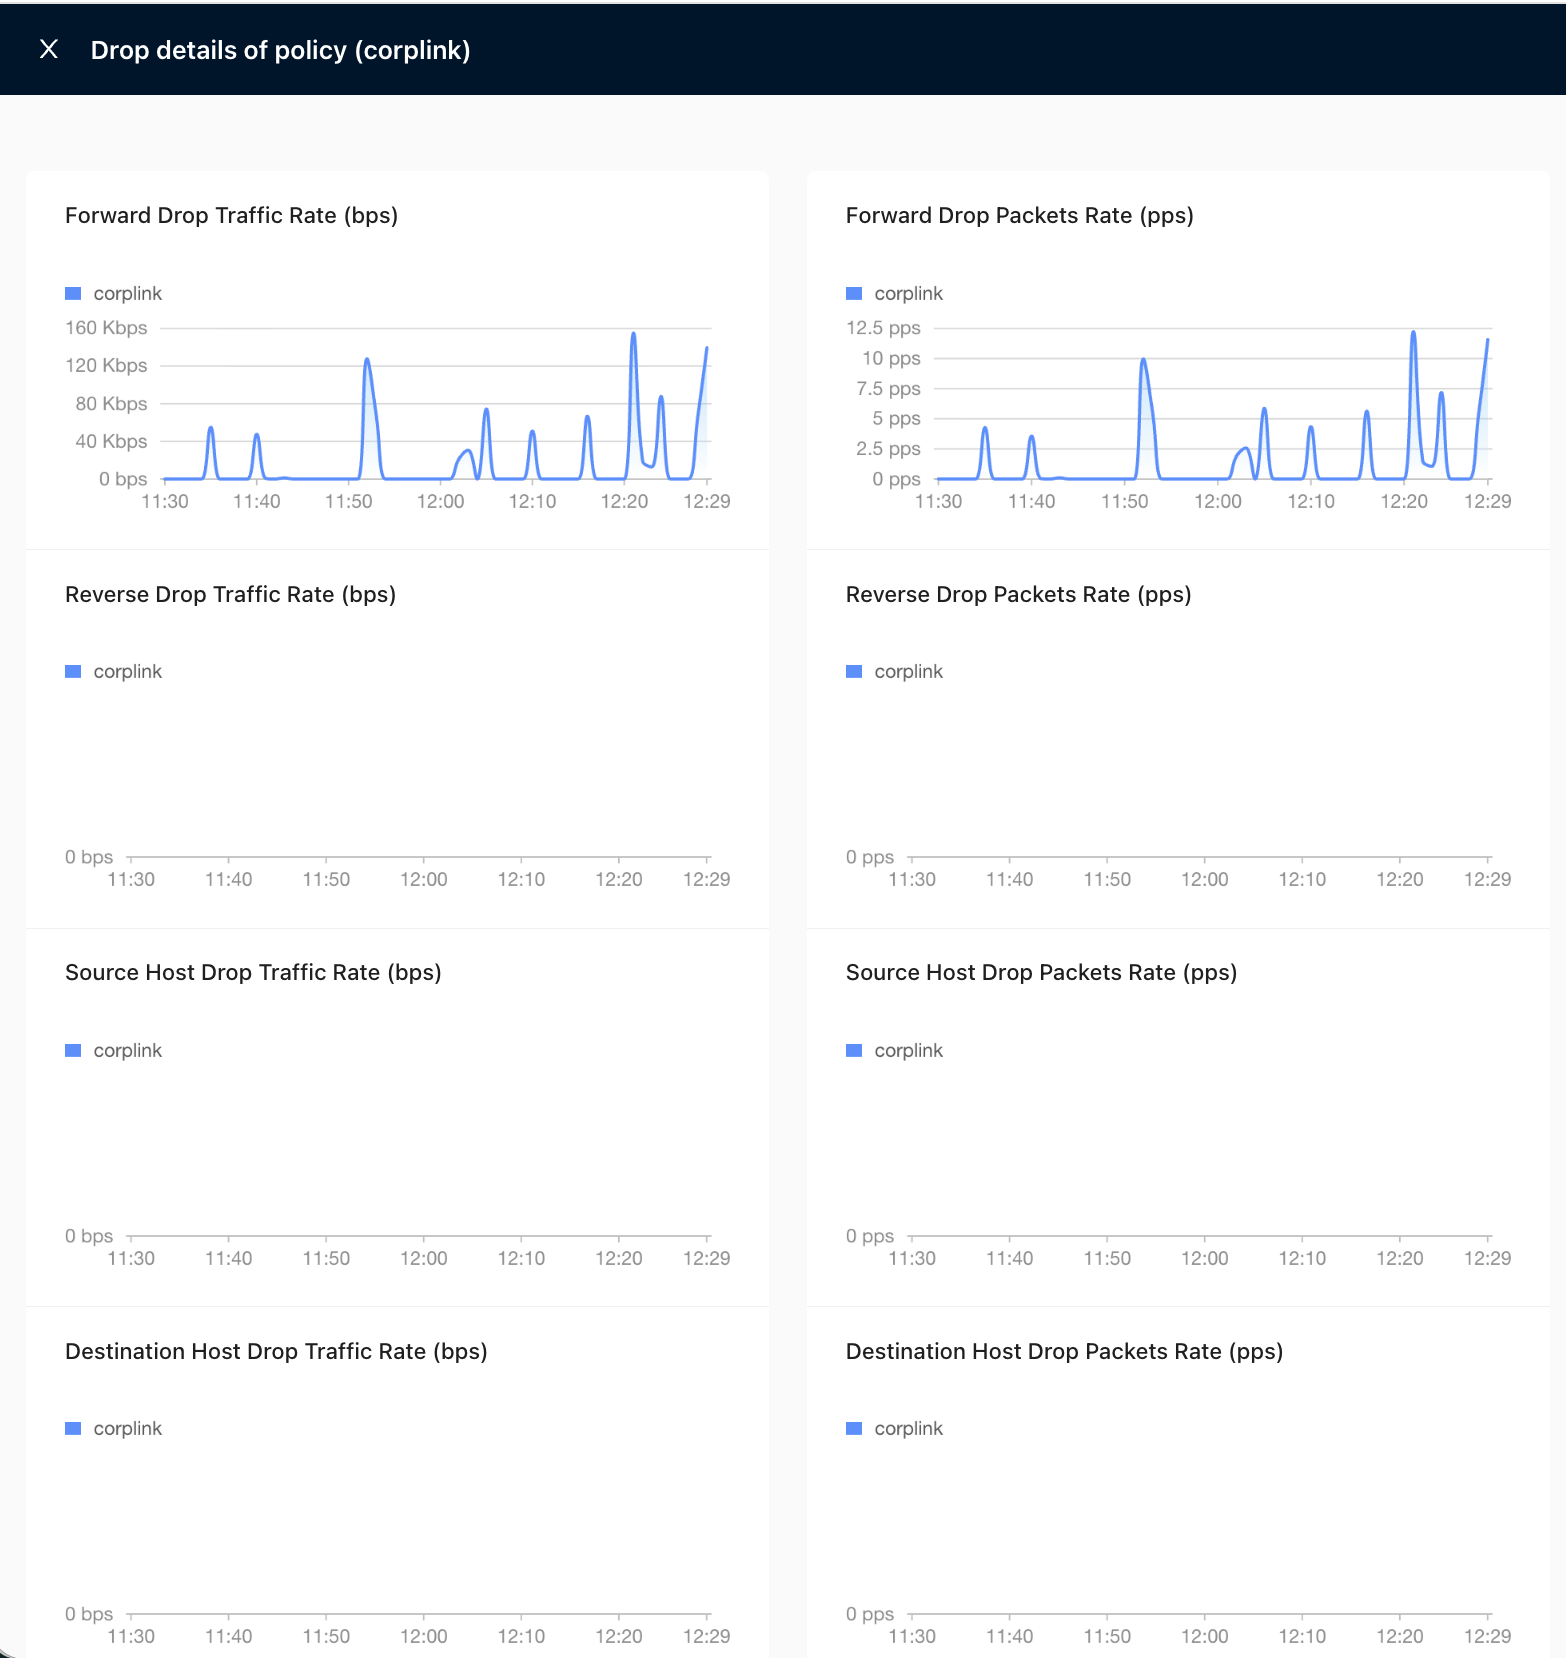
- Packet loss details
- Packet loss statistics at each time point within the selected time range.
Click "Details" to open the details page.
The details page is shown below. Move the pointer over a time point to view packet loss statistics for that time.
Firewall Policy
ACL Firewall Hit Query
- Supported on device version 6.4.4 or later.
- Query ACL firewall policy hits.
- Hit Statistics
Path: Site Detail → Policies → Firewall Policy
- Rule hit statistics within the selected time range.
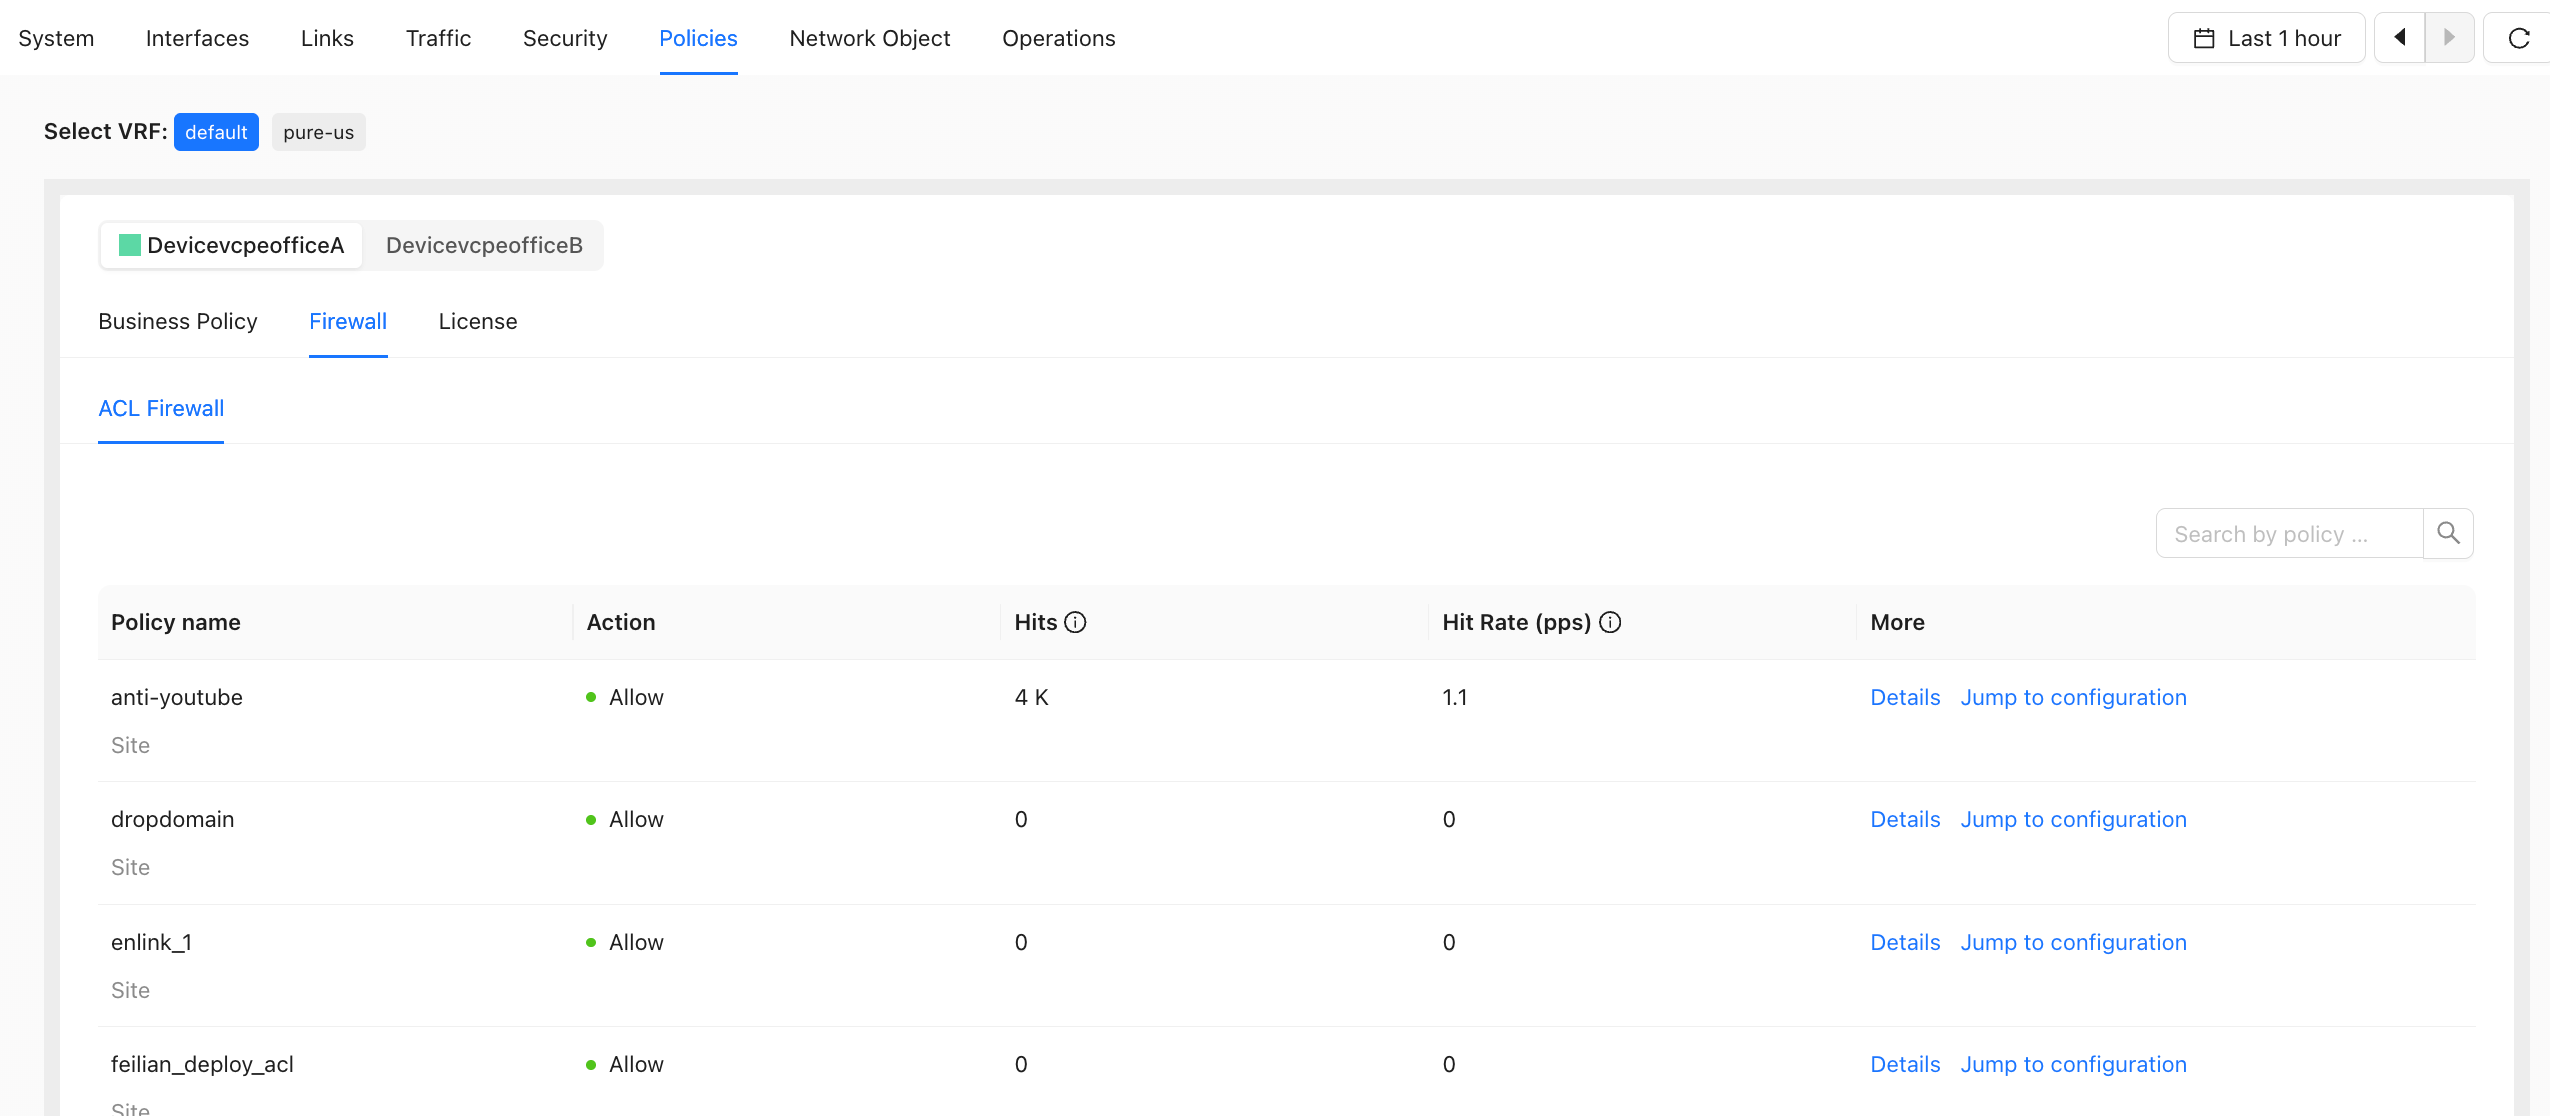
- Parameter Description
| Parameters | Description |
|---|---|
| Hits | Number of hits within the specified time range |
| Hit Rate (pps) | Hit rate within the current 5-minute interval (pps) |
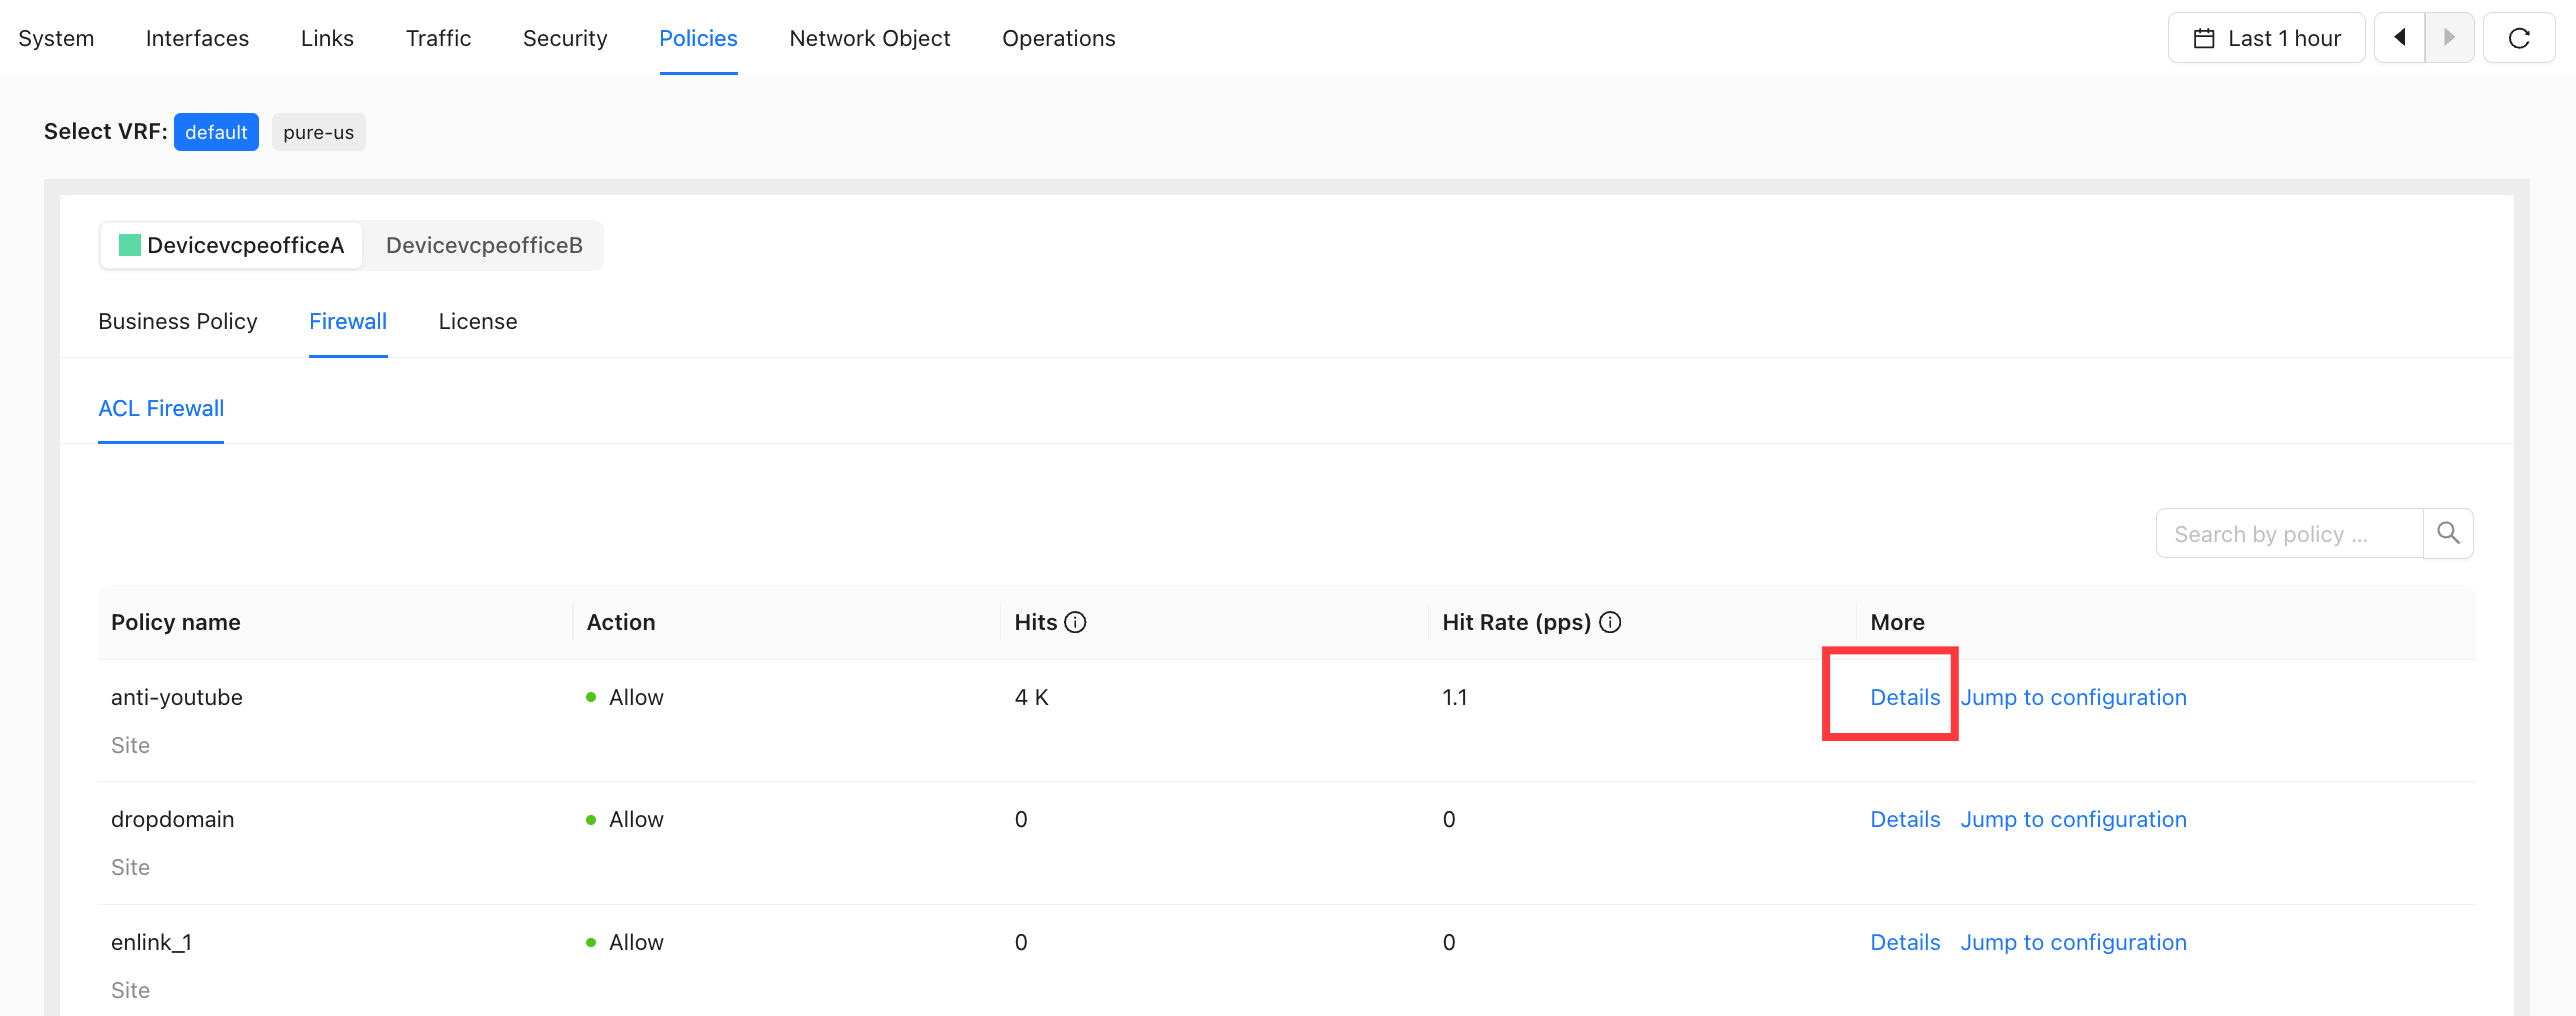
- Hit Details
- Hit statistics at each time point within the selected time range.
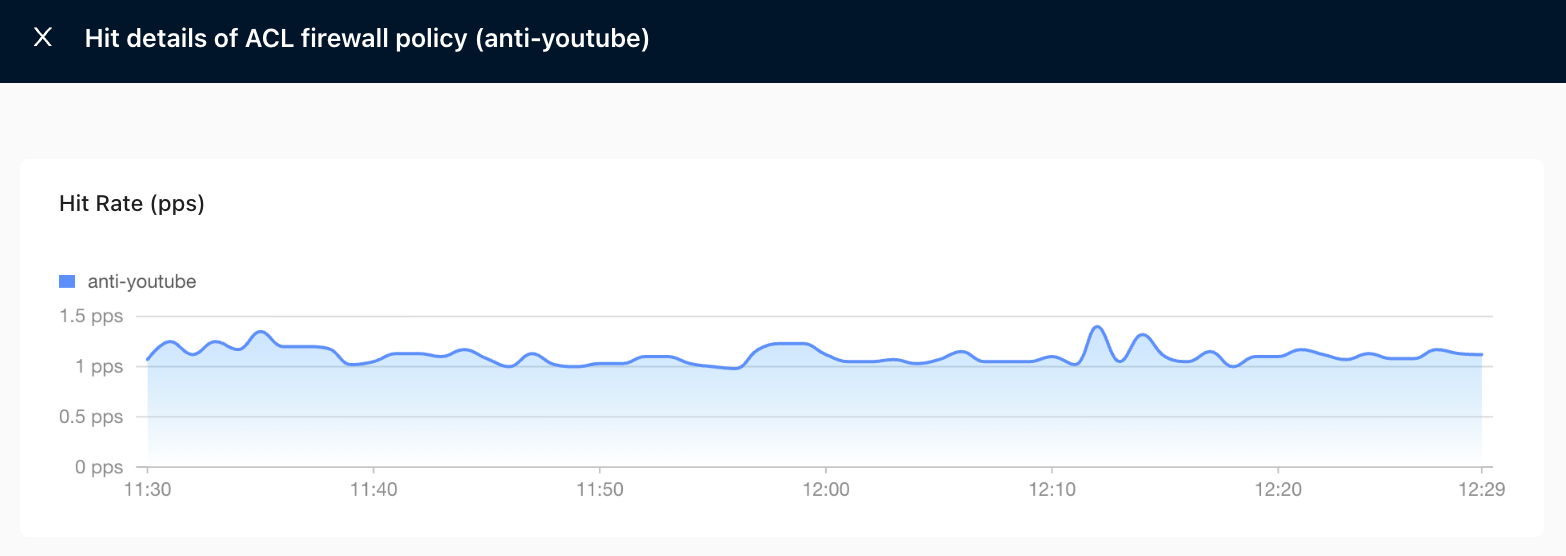
Click "Details" to open the details page.
The details page is shown below.
License Policy
- Supported on device version 6.5.1 or later.
- Packet loss statistics
Path: Site Detail → Policies → License Policy
- Packet loss statistics at each time point within the selected time range.
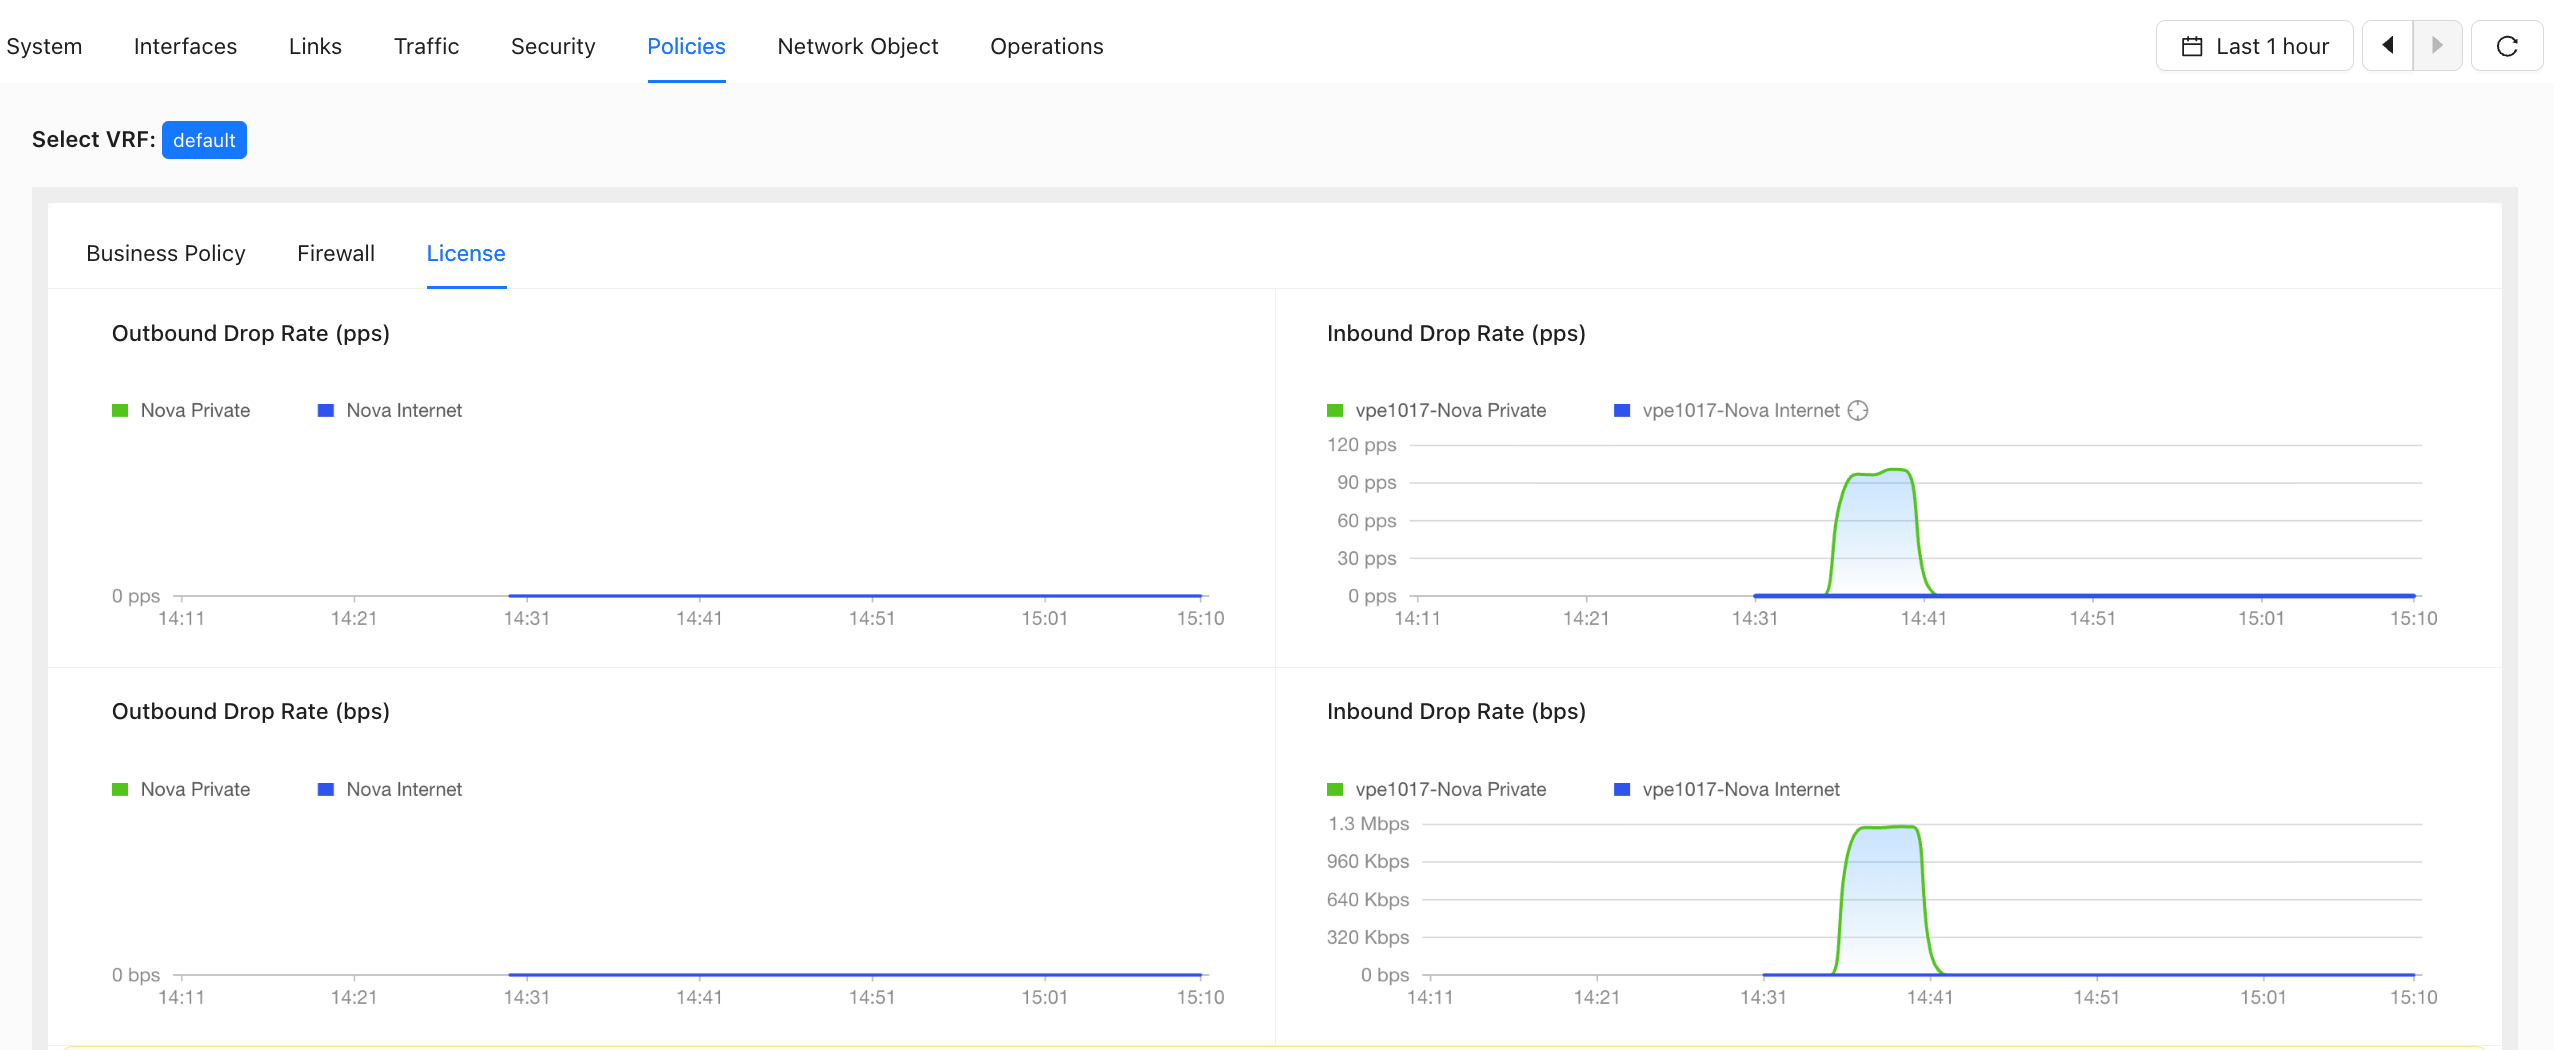
- Parameter Description
| Parameters | Description |
|---|---|
| Outbound Packet Loss (pps) | Packet loss rate at the current time point (pps) |
| Inbound Packet Loss (pps) | Packet loss rate at the current time point (pps) |
| Outbound Packet Loss (bps) | Packet loss rate at the current time point (bps) |
| Inbound Packet Loss (bps) | Packet loss rate at the current time point (bps) |
Network Object
- View status information related to site network objects.
Route Track
Path: Site Detail → Network Object → Route Track
Route Track is used to view the current and historical status of Tracks configured at the site. After a static route, SNAT rule, or other configuration references a Route Track, you can use this page to determine whether the corresponding Track is healthy.
For HA unified WAN management and NAT egress control scenarios, see HA Unified WAN Management.
- Track Name: Displays the Route Track name. Click the Track name to go to the corresponding configuration.
- Configuration Source: Displays the Route Track configuration source, such as global configuration or VRF.
- Interface: Displays the interface used by the Route Track. If no interface is specified, "-" is displayed.
- Detection Target: Displays the detection IP address configured for the Route Track.
- Current Status: Displays the detection result on each device, such as UP, DOWN, or no data.
- You can filter Tracks by device and search by Track name.
- If a globally configured Track is bound to a shared WAN, it is displayed under both devices. If it is bound to a non-shared WAN, it is displayed only under the corresponding device.
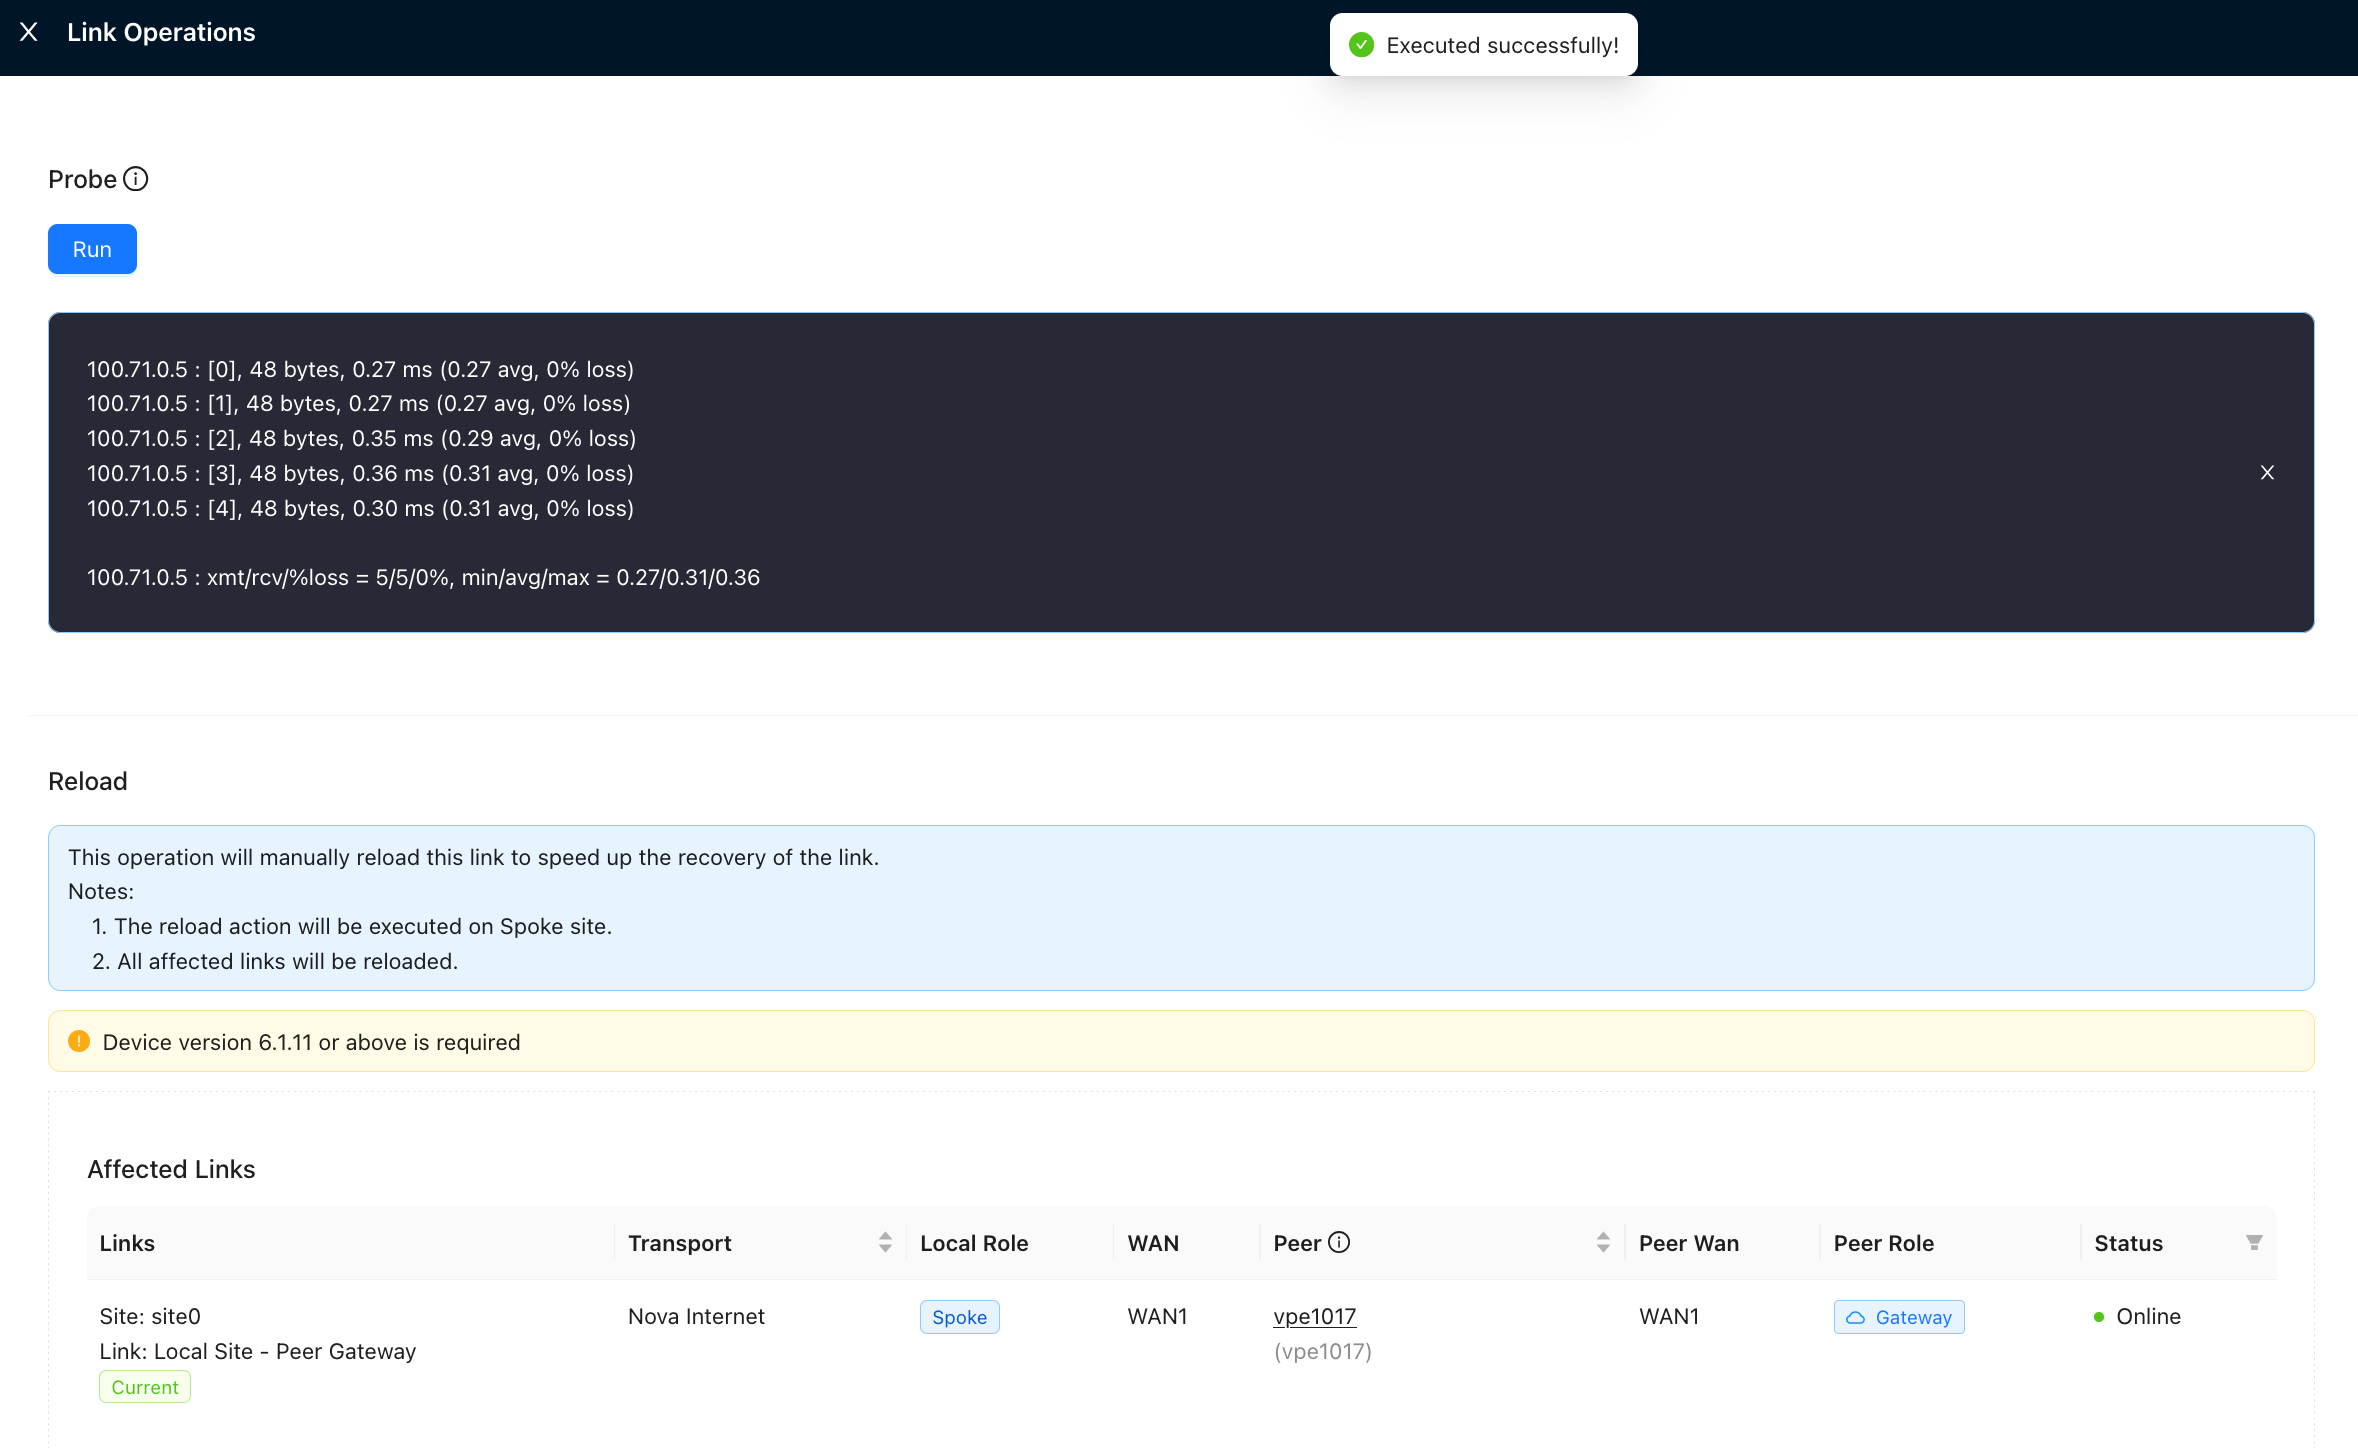
Operations
Path: Monitor → Sites → Site Detail → Operations
Includes site diagnostic and maintenance tools.
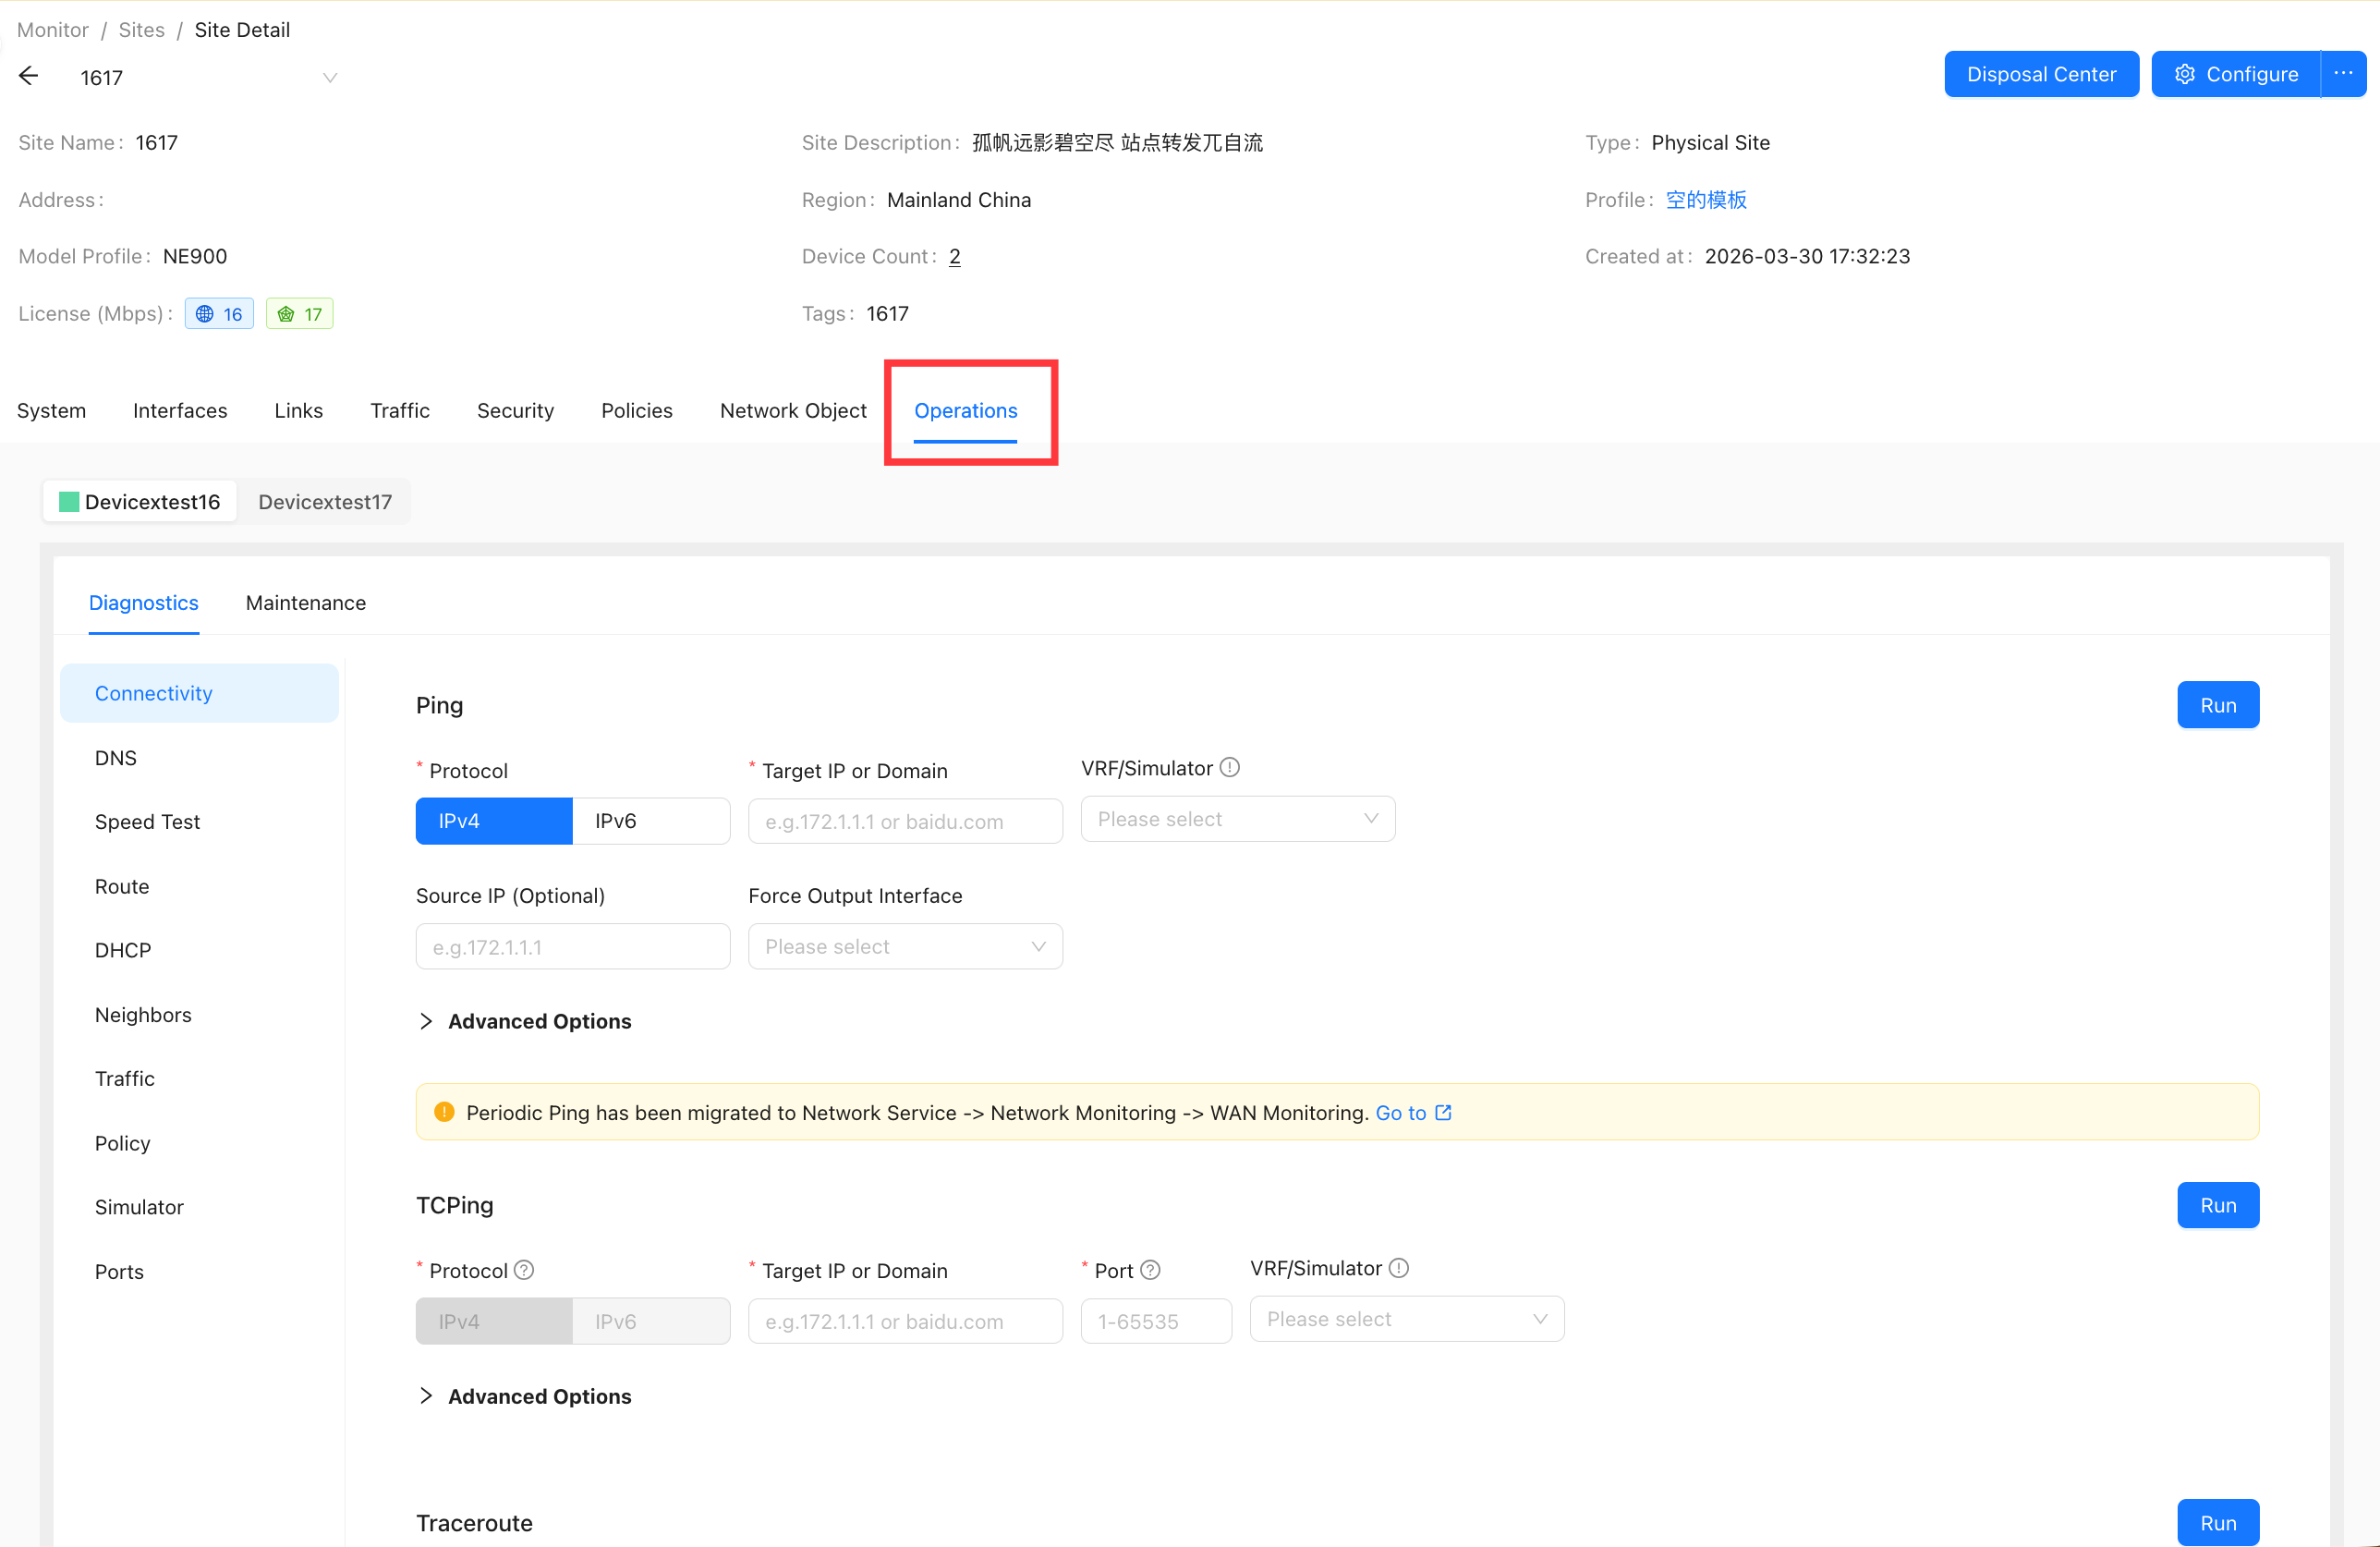
Diagnosis
Path: Monitor → Sites → Site Detail → Operations → Diagnosis
- Site diagnostic tools.
- Tool categories include Connectivity, DNS, Speed Test, Routing, DHCP, ARP, Traffic, Policy Hits, and Simulator.
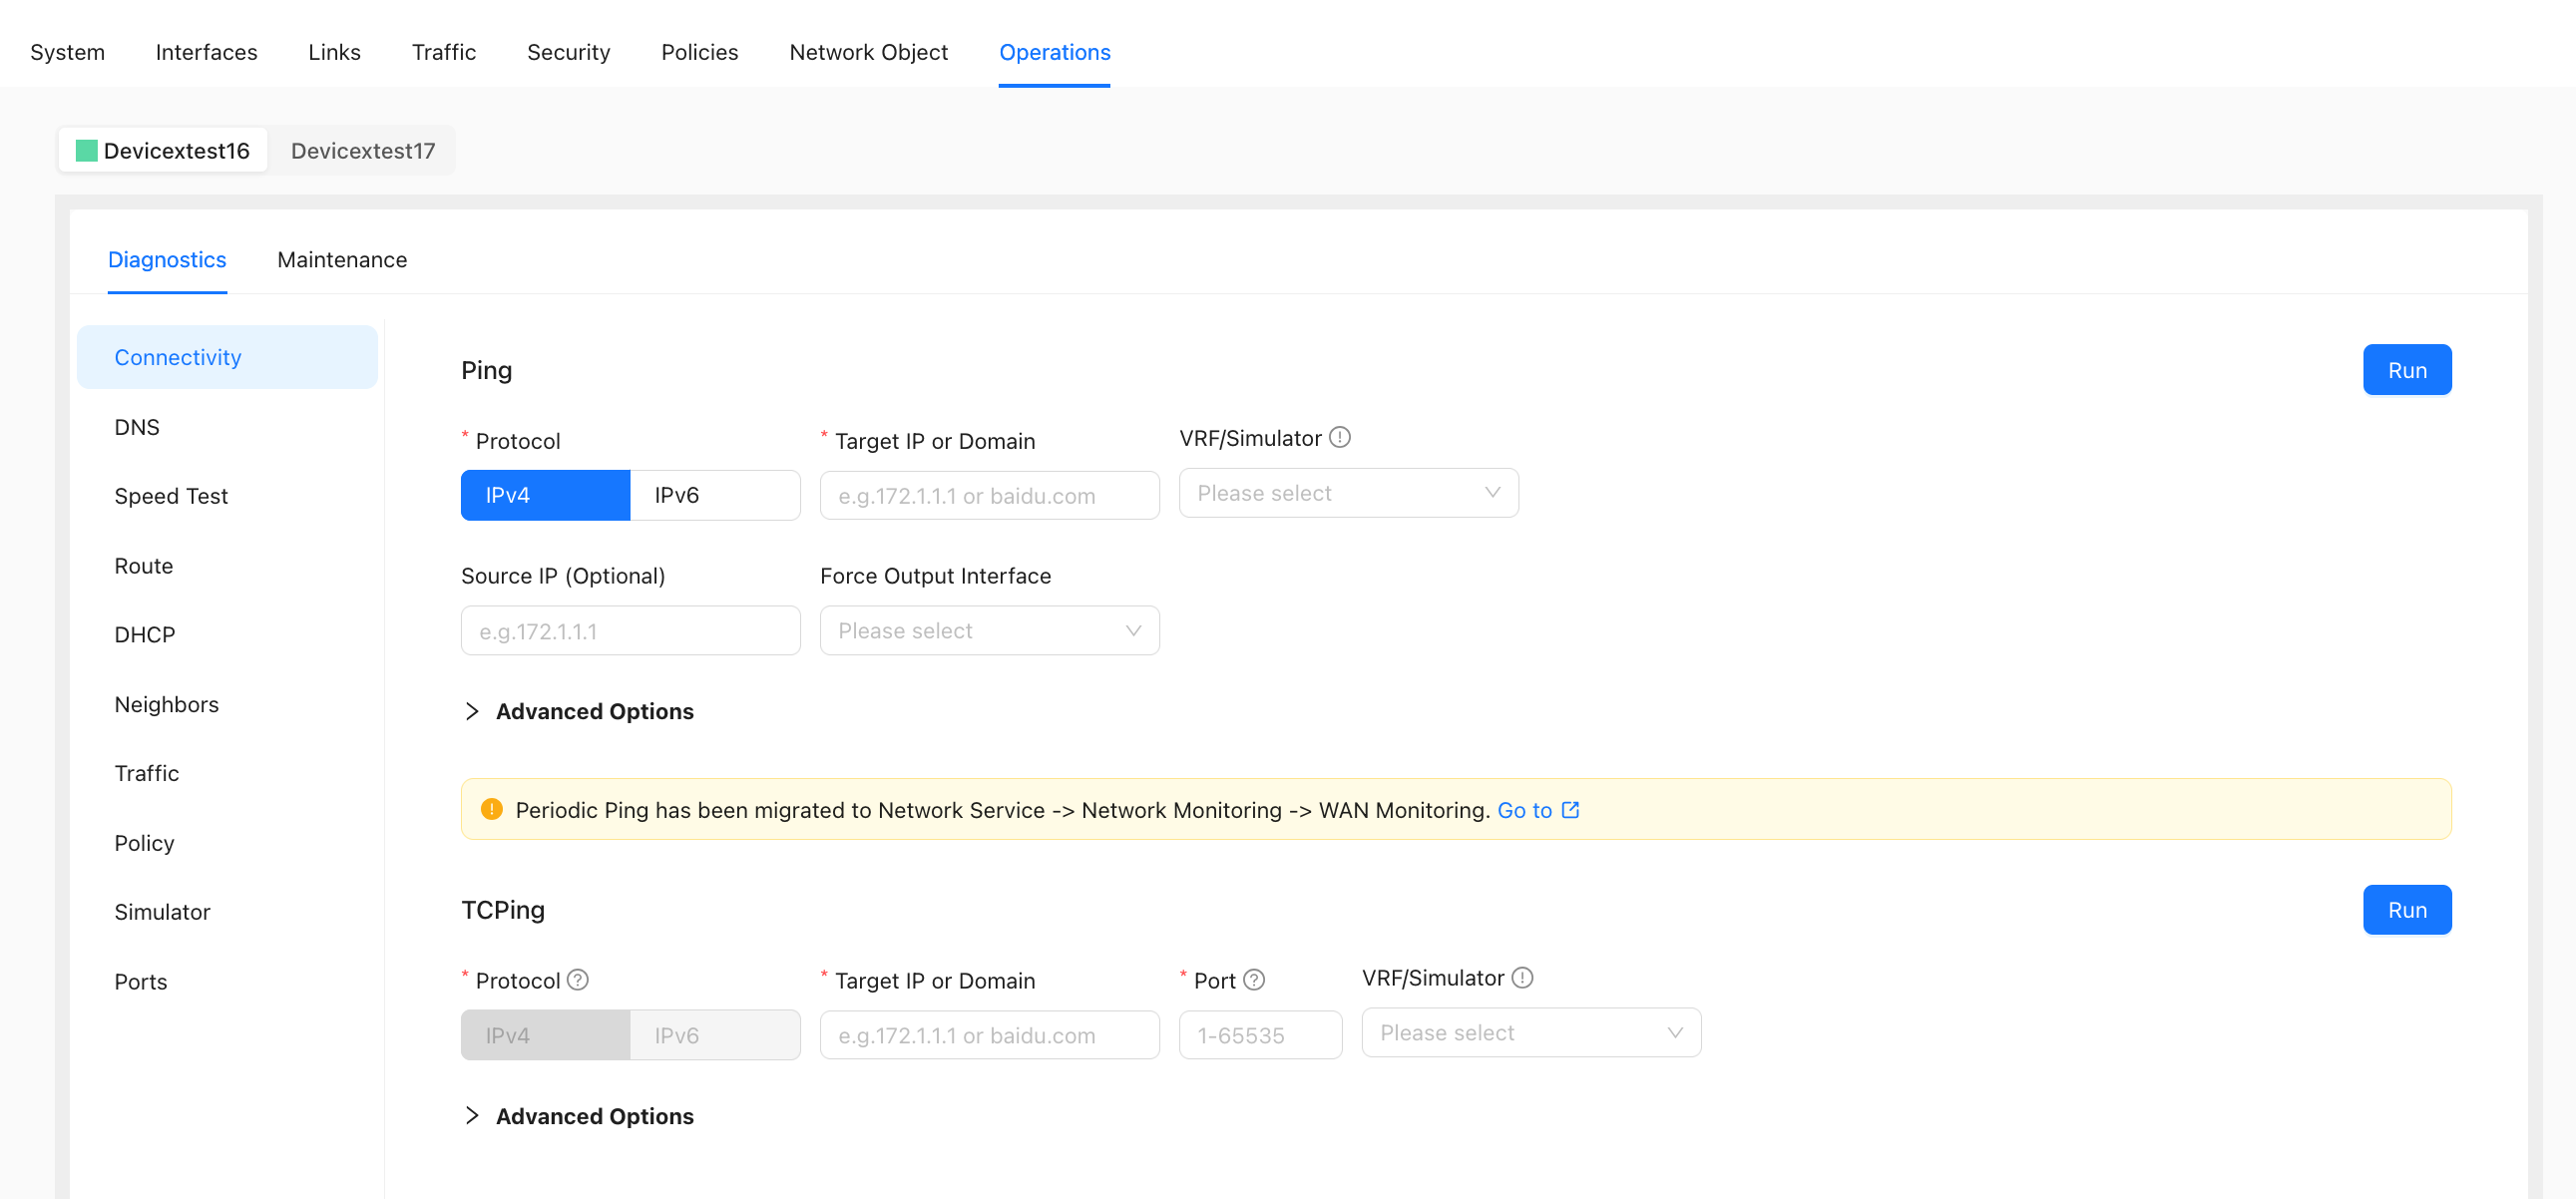
Connectivity
- Includes: Ping, Traceroute, HTTP, MTR, NC, MTU detection
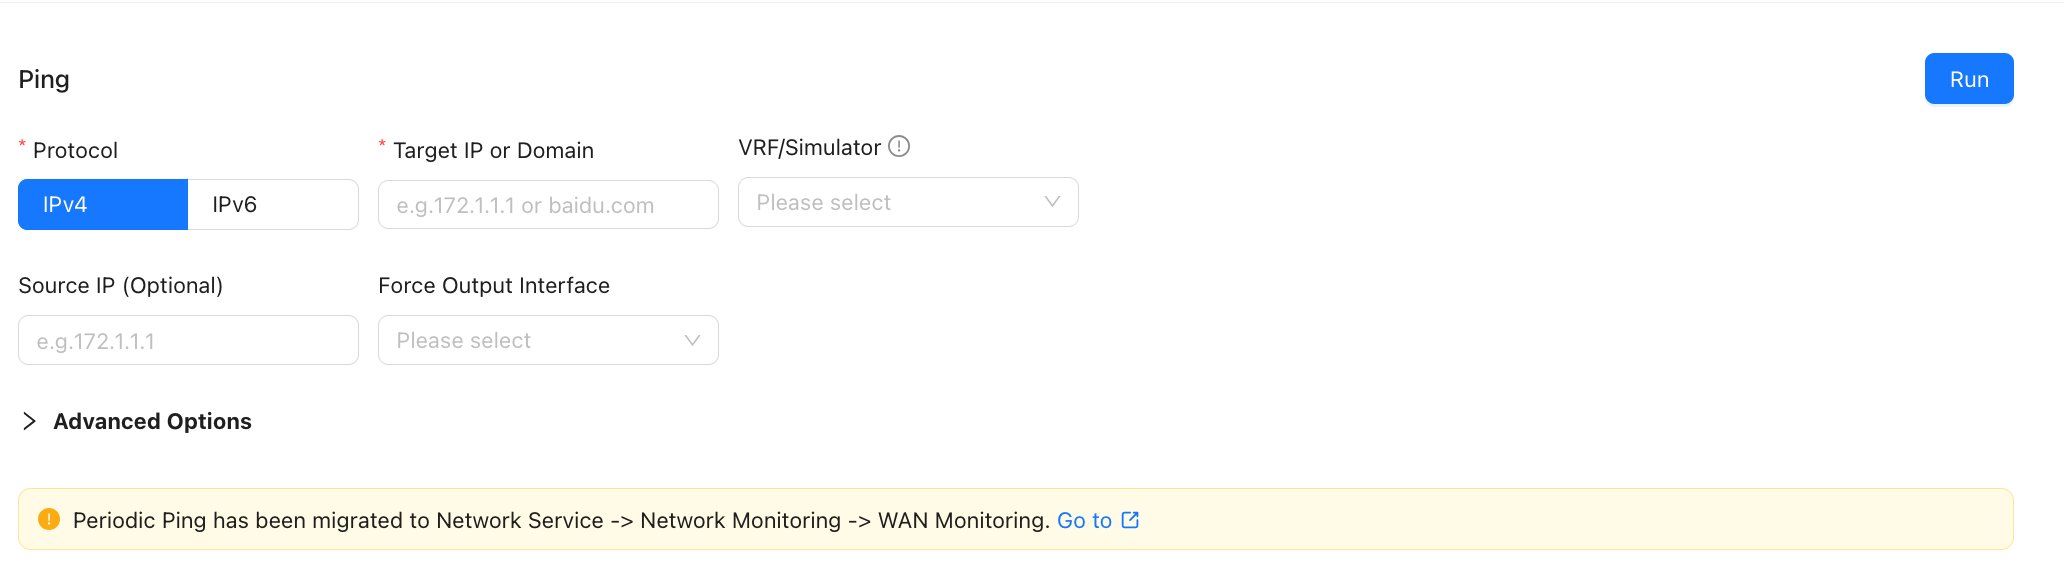
Ping
Tests the quality and speed of the device's network connection.
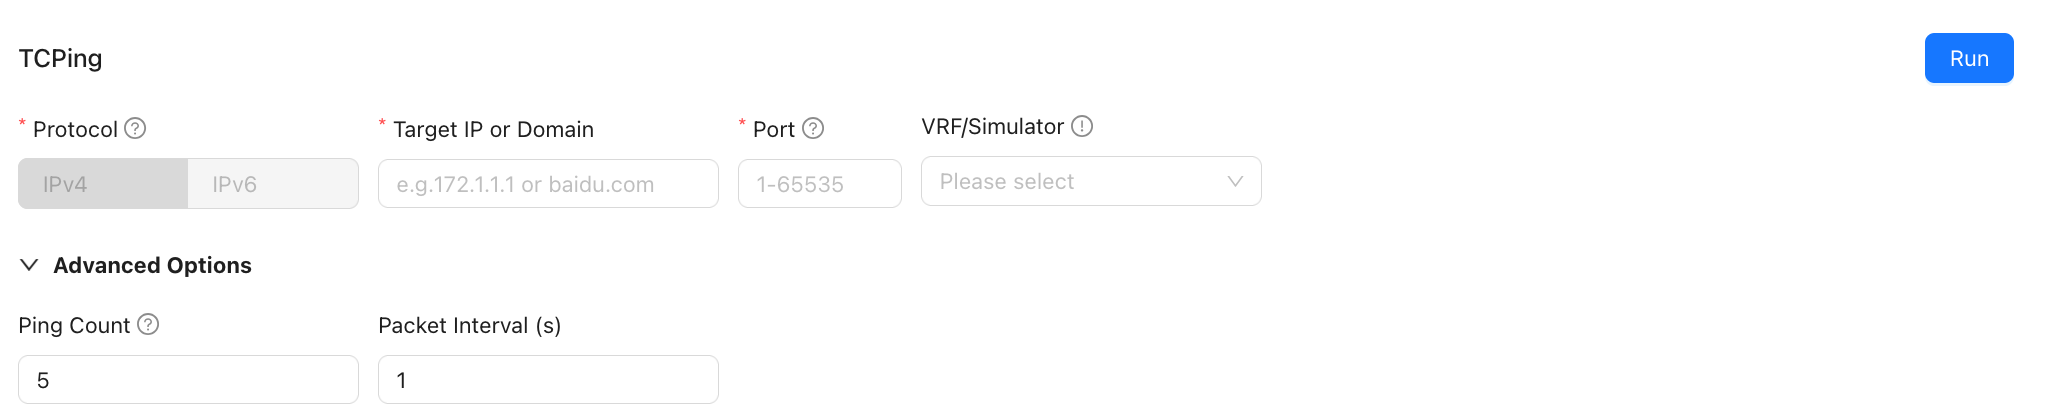
TCPing
Actively initiates a TCP connection request to detect service port connectivity, connection status, and network latency in real time.
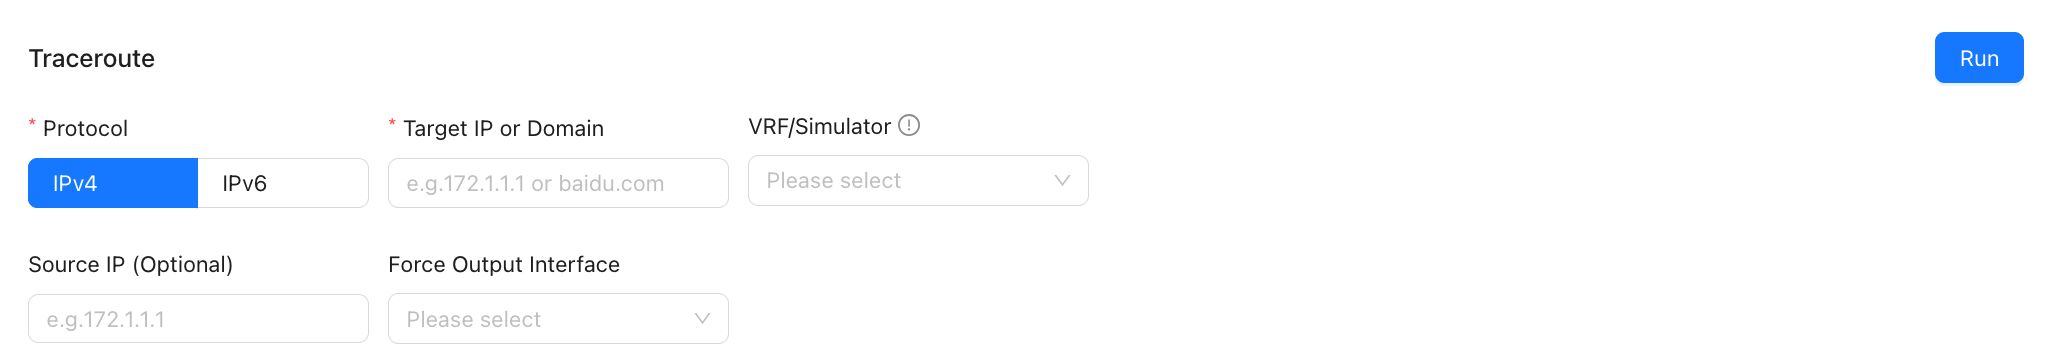
Traceroute
Traces the path that packets take from the device to the target host.
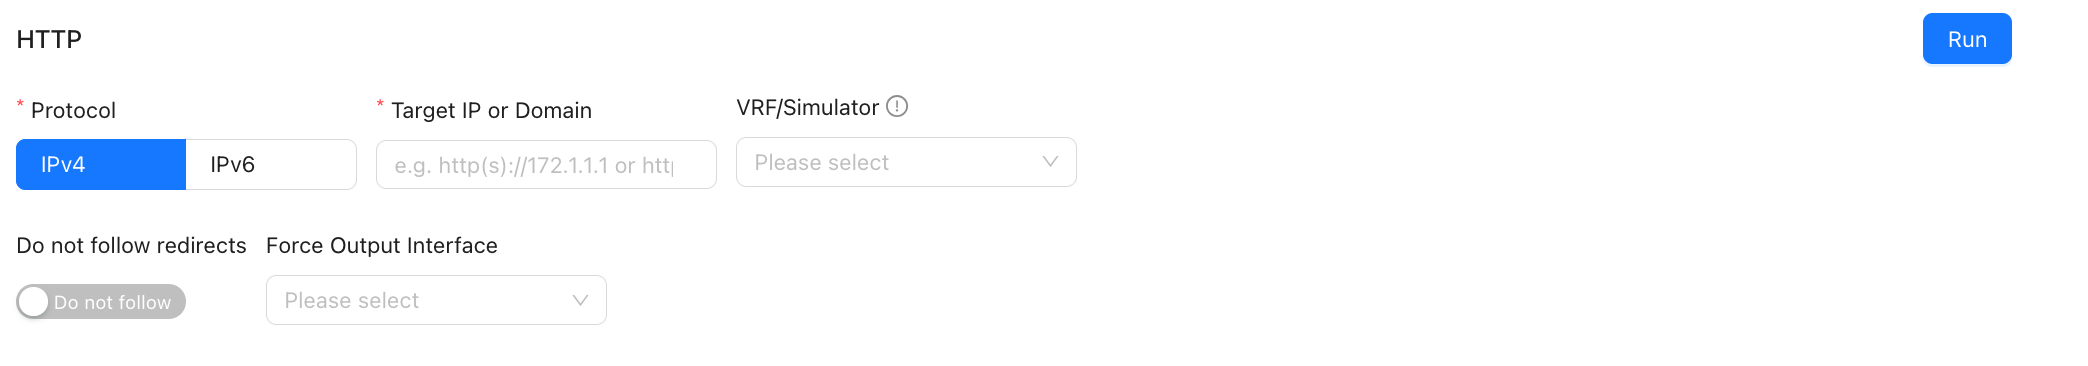
HTTP
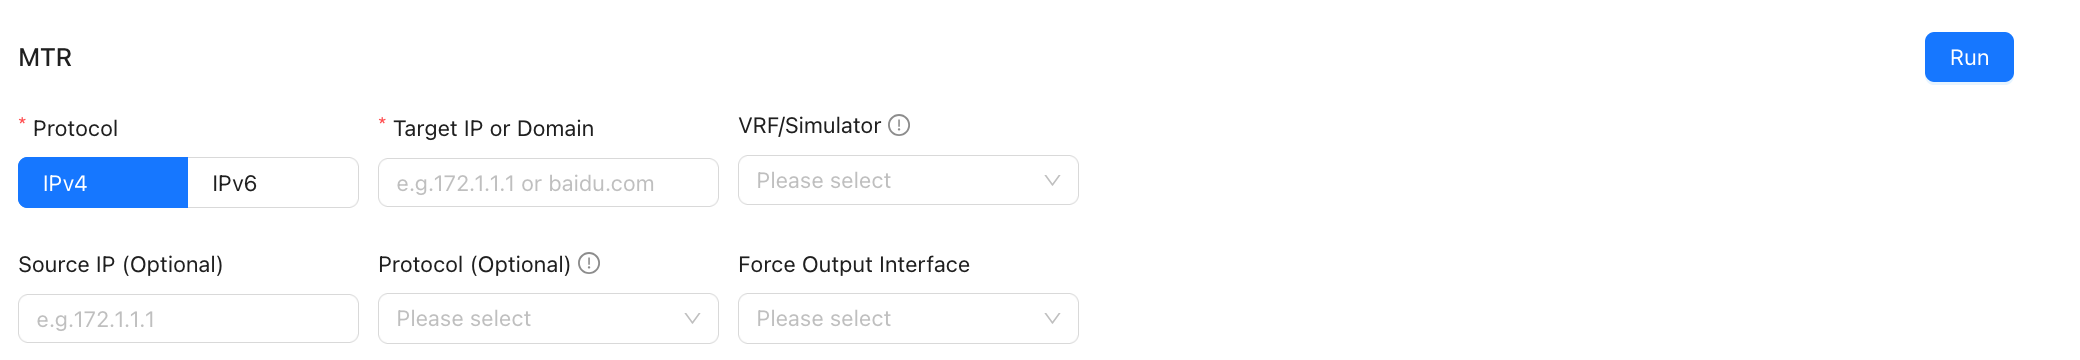
MTR
Combines Traceroute and Ping capabilities.
NC
Initiates a TCP or UDP connection to test port connectivity.
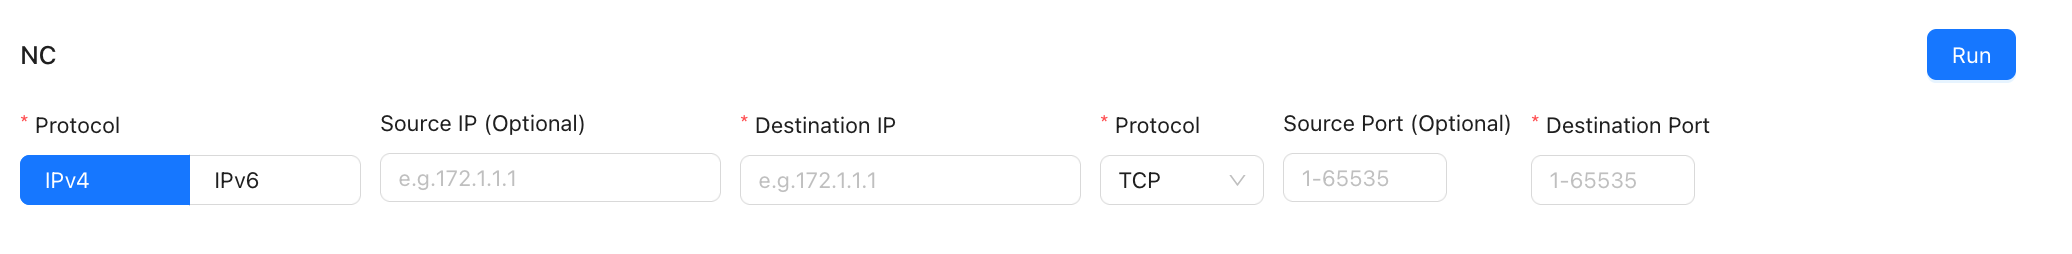
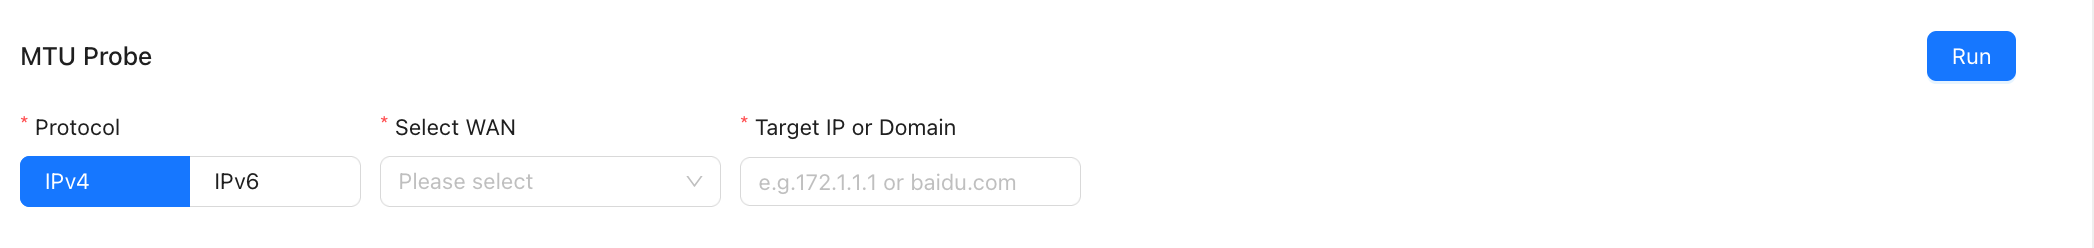
MTU detection
Detects the MTU of the WAN interface.
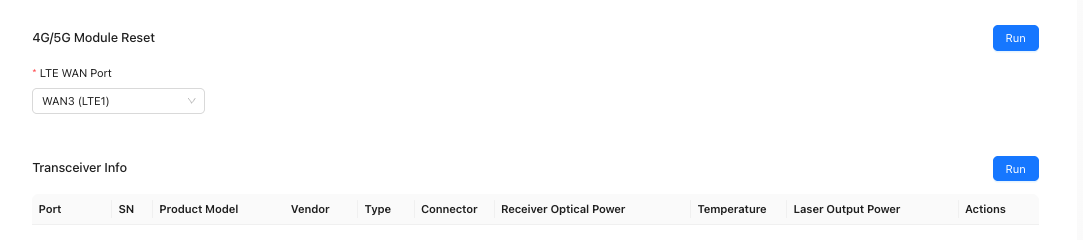
4G/5G module reset
Resets the 4G/5G module.

DNS
- Includes: Nslookup, lookup DNS cache, clear DNS cache
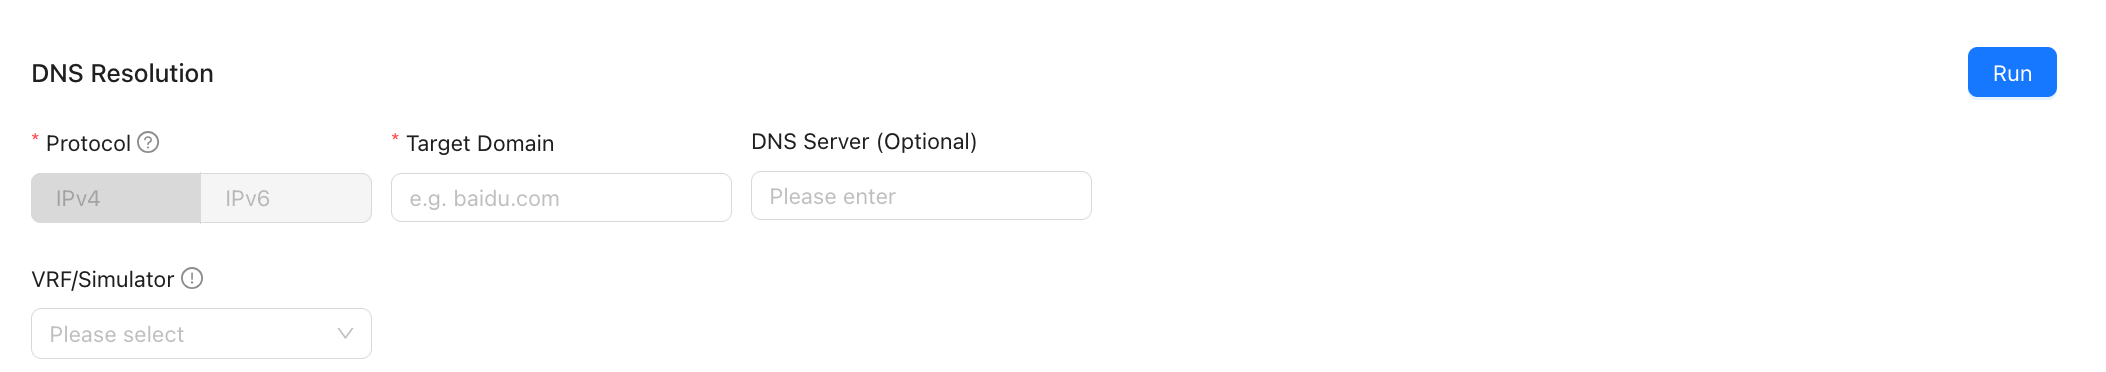
DNS Resolution
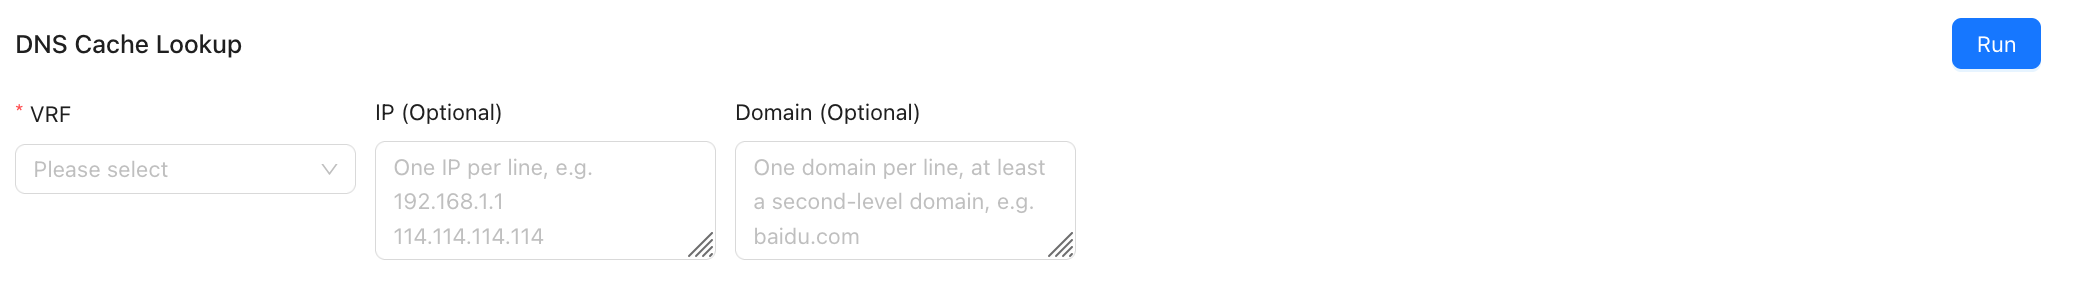
Look Up DNS Cache
Queries the mapping between IP addresses and domain names by IP address or domain name.
The IP information corresponding to a domain name can be queried only after traffic hits a policy related to the domain name address group.
- Add the domain name to an Address Group.
- Configure a policy that references the Address Group.
- Ensure traffic has hit the policy.
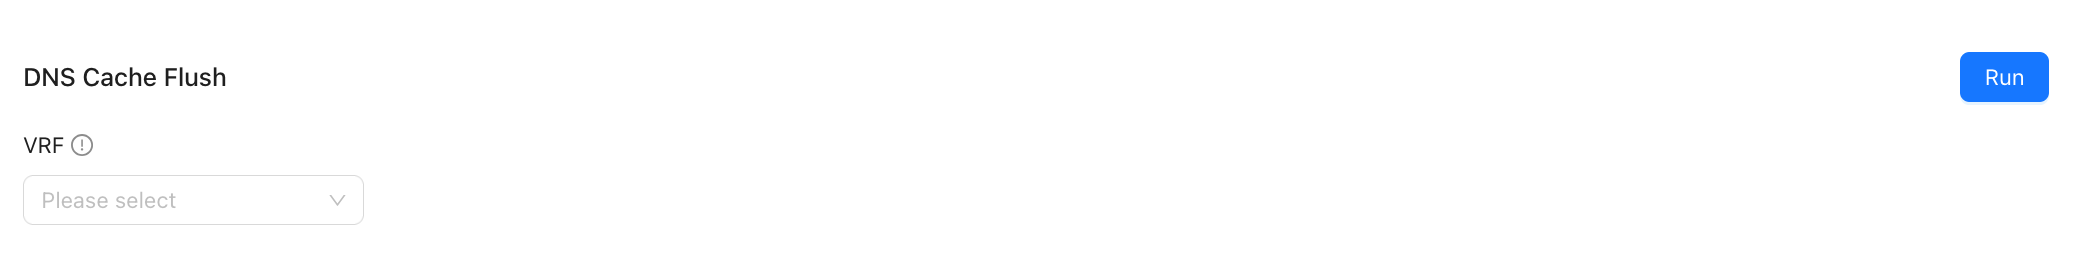
Clear DNS cache
Clear the DNS cache when switching the acceleration egress.
Speed Test
- Includes: Internet Speed Test and Peer-to-Peer Speed Test.
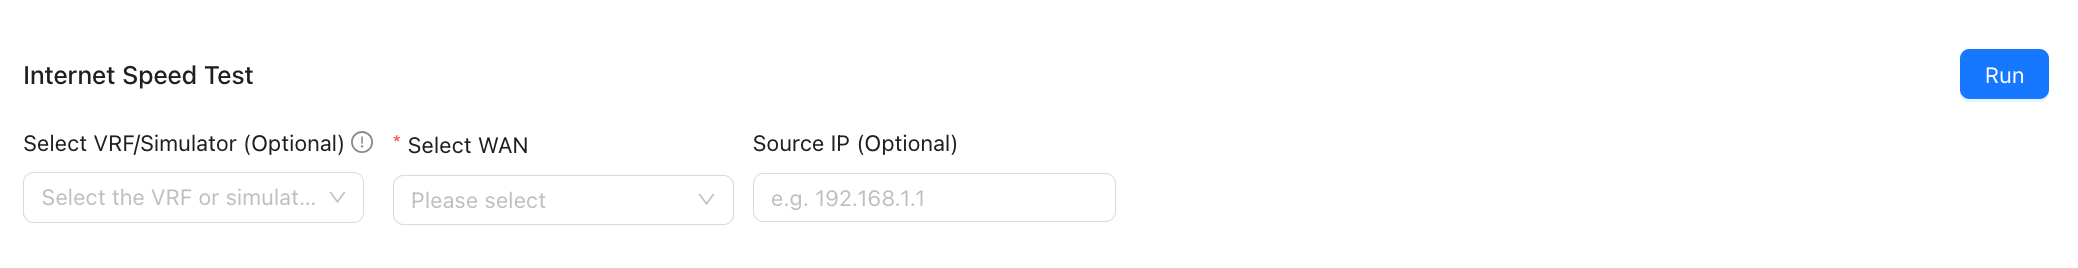
Internet Speed Test
Tests the bandwidth of a site VRF or a specified WAN.
- To test a specified WAN, configure DNS on the WAN. Otherwise, the automatic speed test server cannot be found.
- Each speed test can run against either a VRF or a WAN.
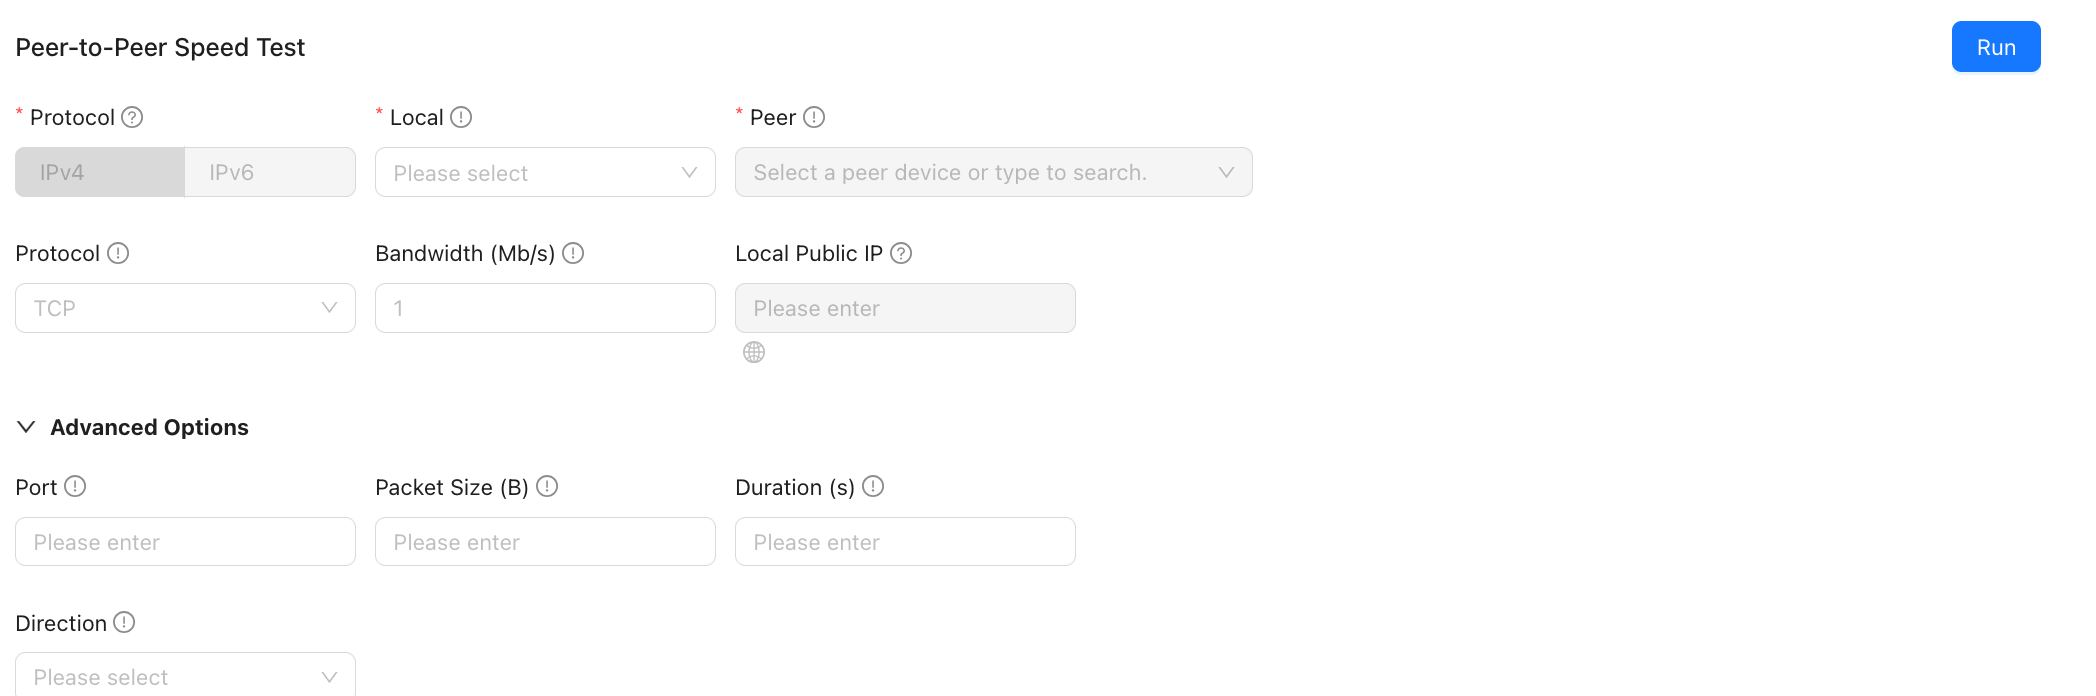
Peer-to-Peer Speed Test
Checks private line quality.
- Select the local environment before selecting the peer device.
- Peer devices include CPE devices and Nova Gateways.
- If the local end selects WAN, the peer end can only select WAN for the speed test. If the local end selects VRF, the peer end can only select VRF.
Routing
- Includes: routing table, route details, and BGP neighbor connection reset.
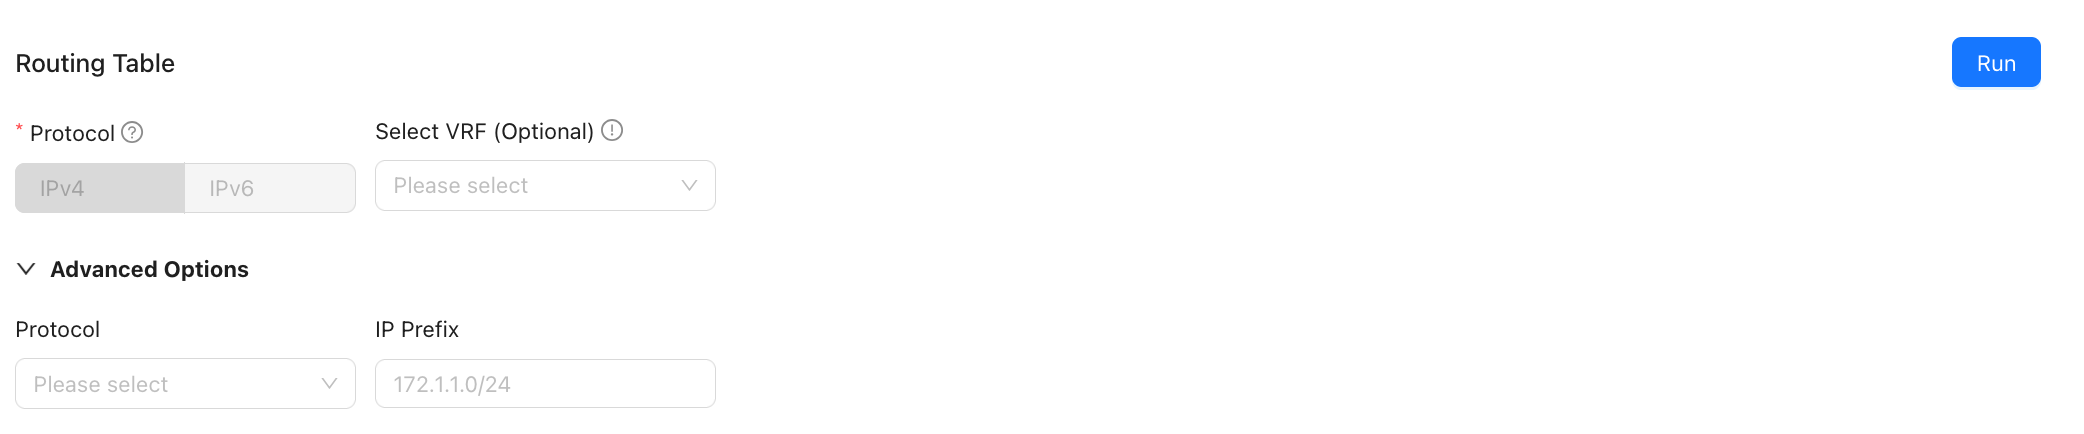
Routing table
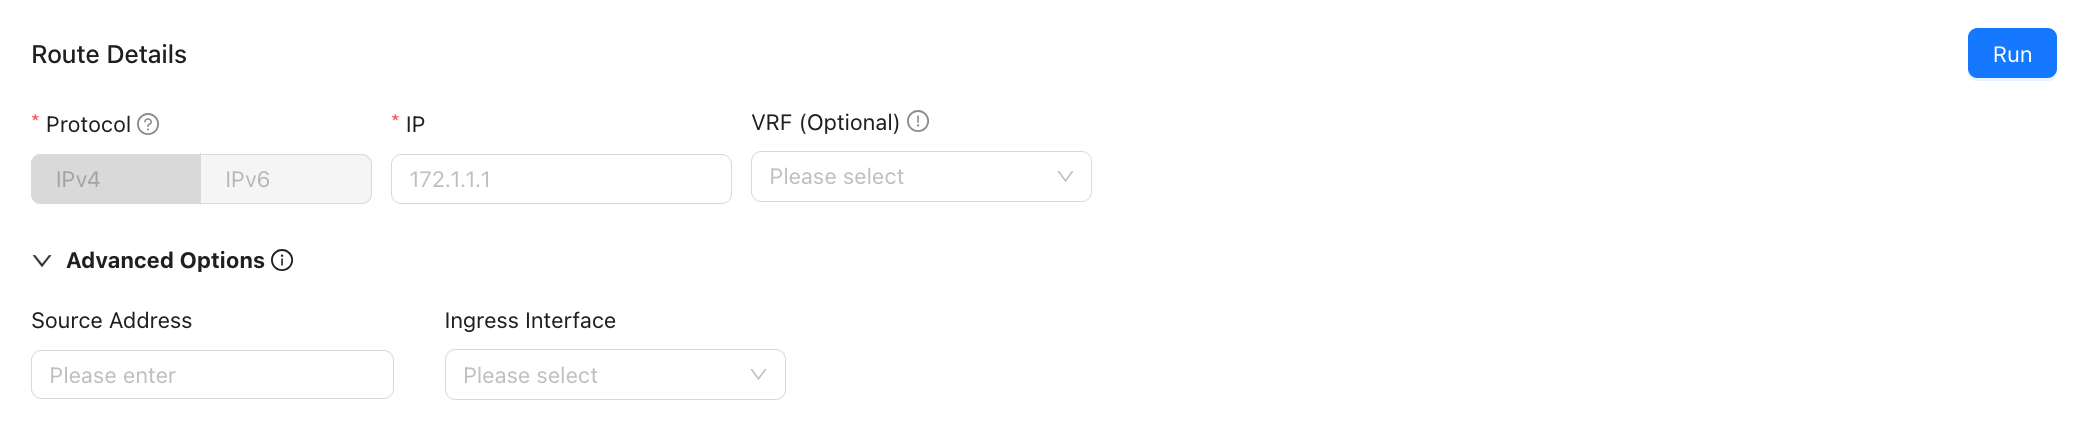
Route details
Finds detailed route information for a specified IP address.
- Source address and inbound interface are optional. If you select an inbound interface, you must enter a source address.
- If only the source address is specified, the source address must be an IP address on the device.
- If both source address and inbound interface are specified, the source address must be an external IP address that can reach the inbound interface.
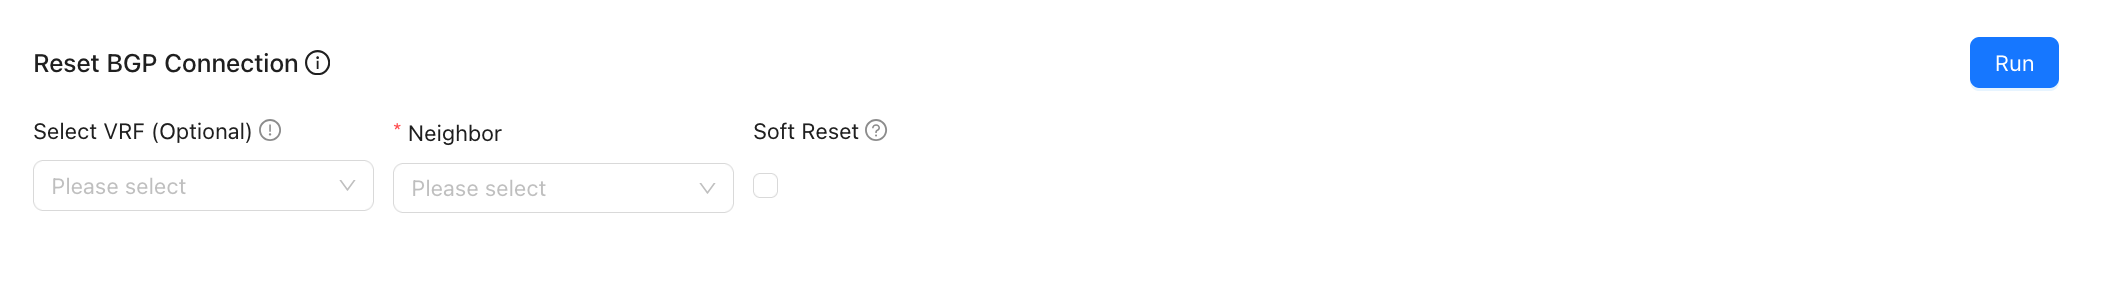
Reset BGP neighbor connection
When the number of routes received from a BGP neighbor exceeds the maximum number of routes allowed locally, the local end rejects the neighbor connection request. In this case, reset the BGP neighbor connection to trigger renegotiation and re-establish the connection.
- By default, the BGP neighbor connection is terminated immediately (Hard Reset), and the BGP negotiation process restarts.
- If Soft Reset is selected, inbound and outbound route updates are triggered again without interrupting the connection.
- When the number of routes received from the BGP neighbor exceeds the maximum number of routes allowed locally, Hard Reset is required to re-establish the connection.
DHCP
- Includes: DHCP host, DHCP reset
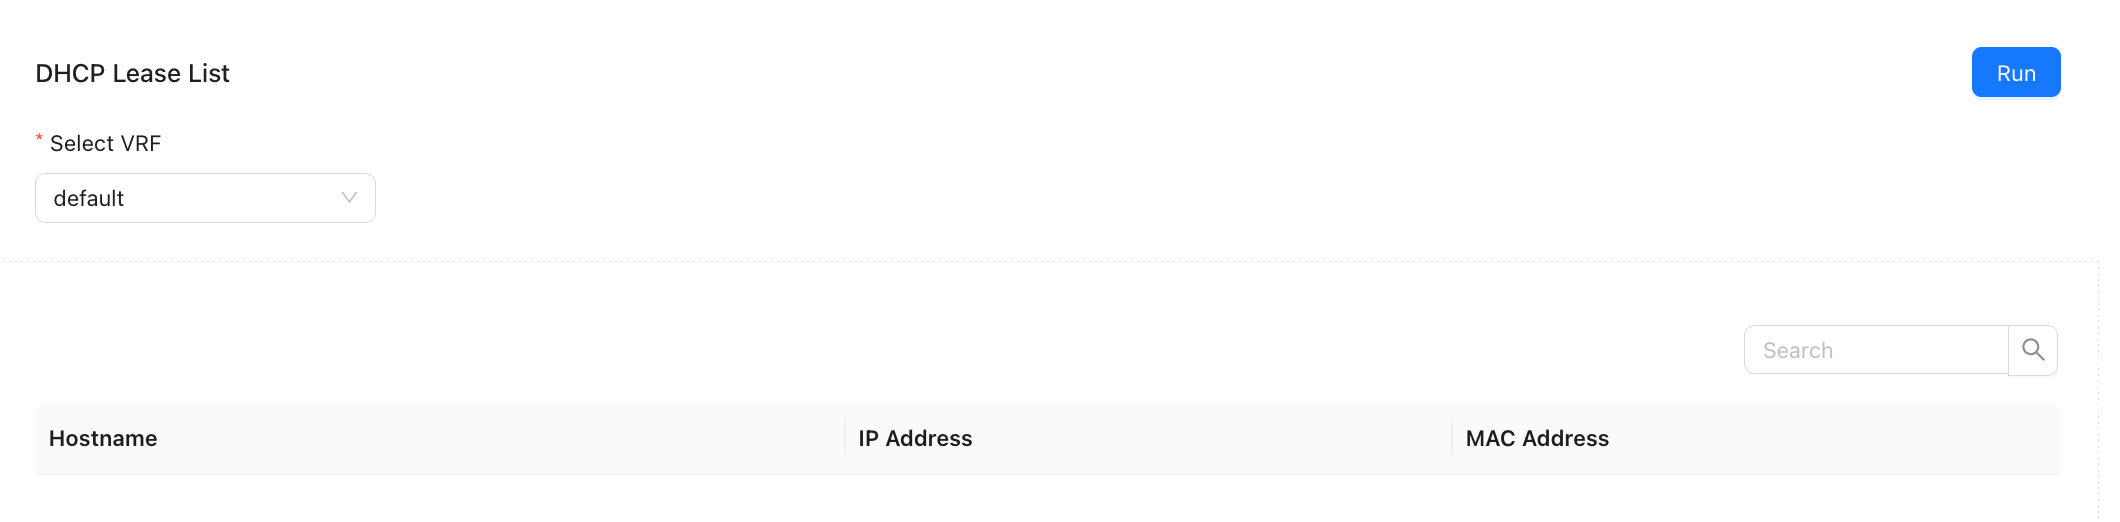
DHCP host
- View LAN-side hosts assigned by DHCP.
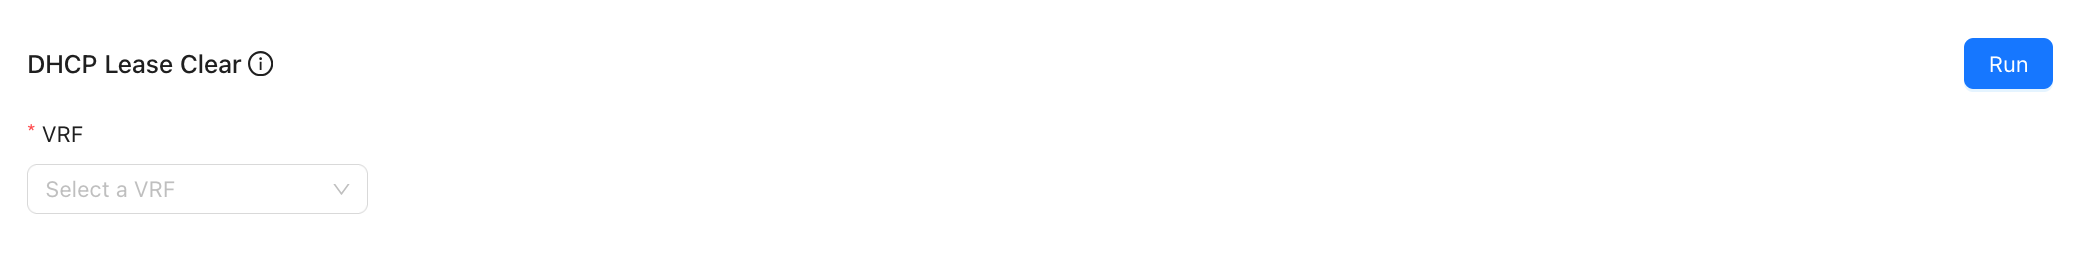
DHCP reset
- Reset LAN-side DHCP bindings.
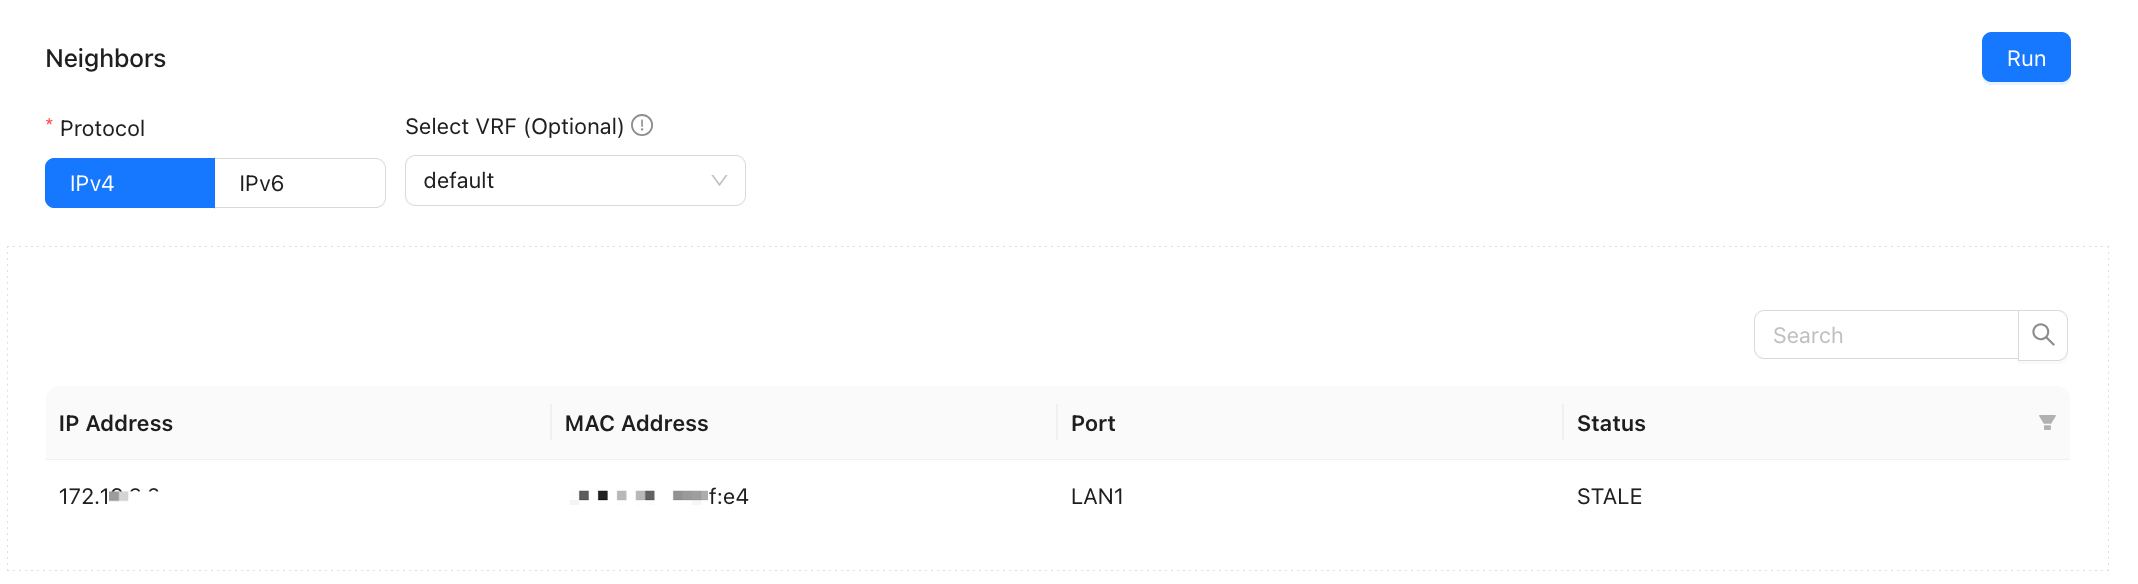
ARP
- View the ARP table.
Traffic
- Includes: Active Flows, TOP Flows, Packet Capture, and Application IP Query.
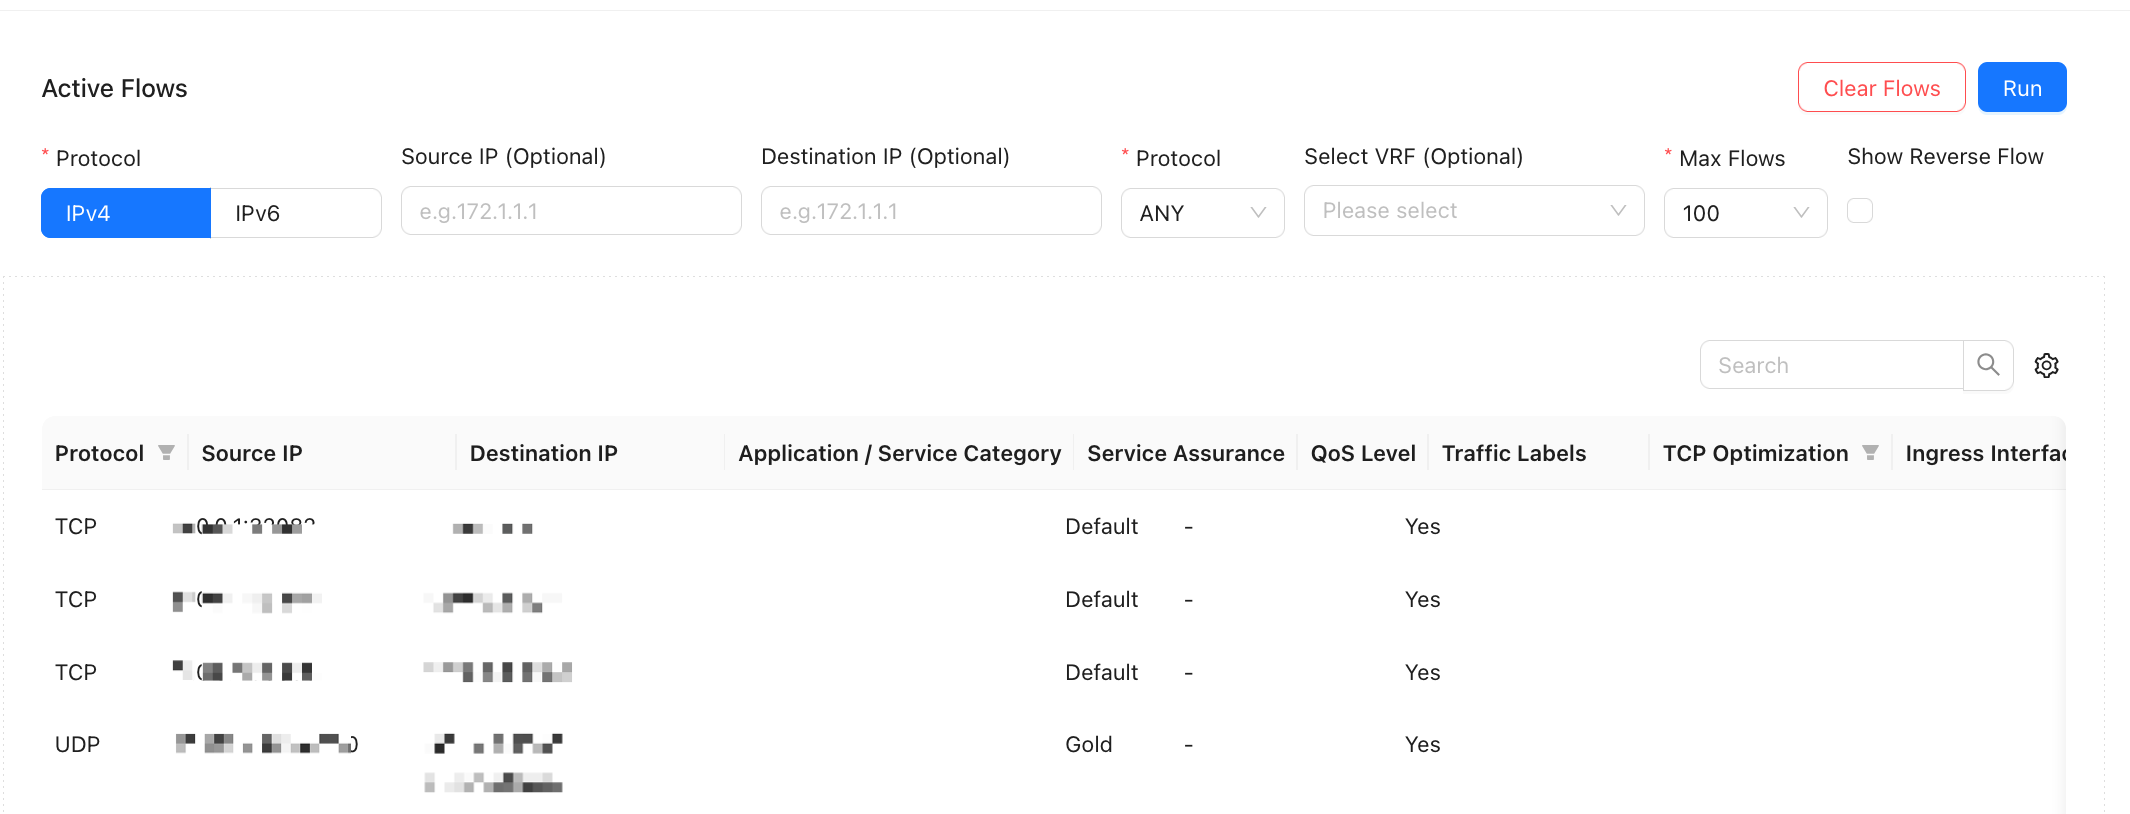
Active Flows
View long-lasting, steady traffic on the device.
- Source and destination addresses are optional. The protocol defaults to ANY.
- VRF can be specified.
- Return traffic can be displayed.
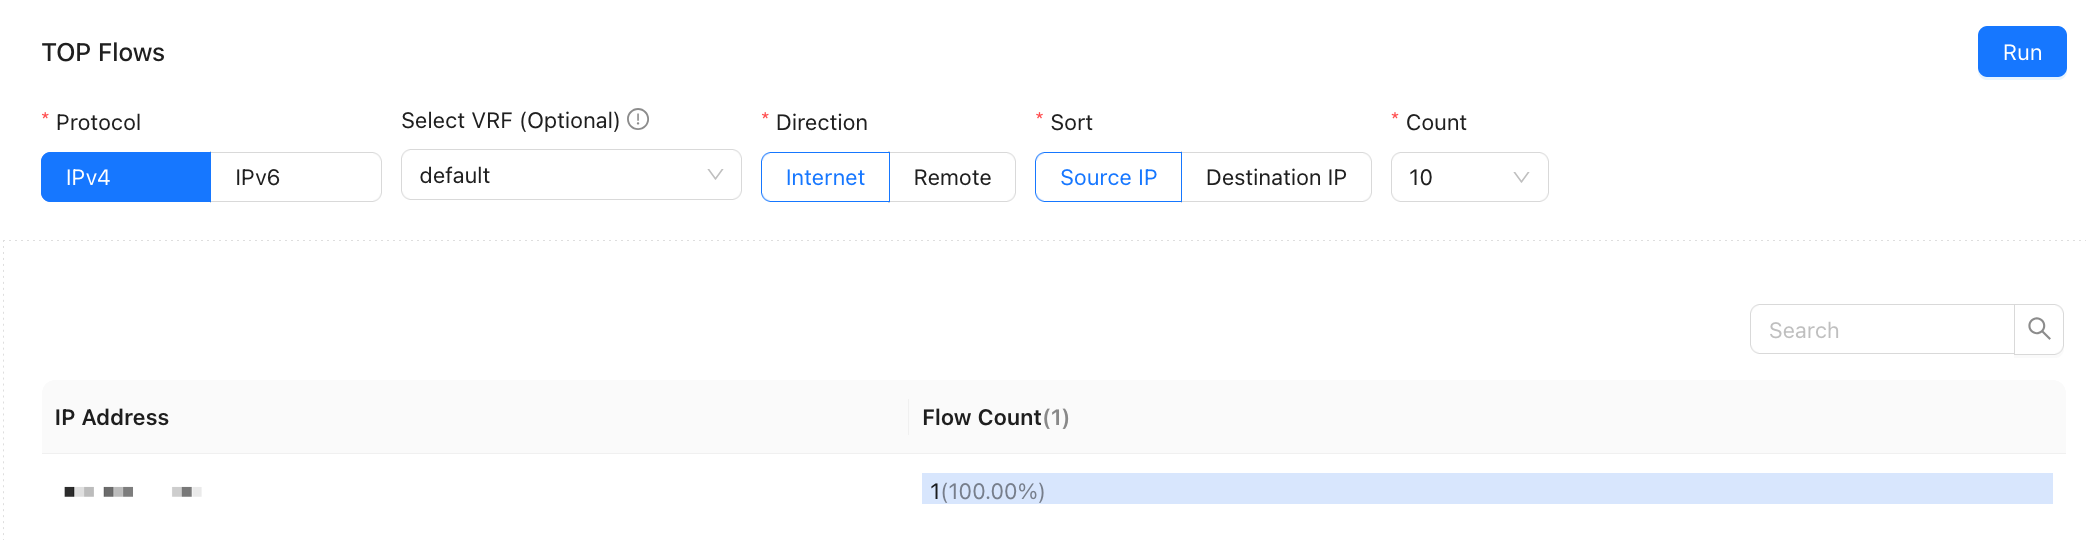
TOP Flows
- View the IP addresses with the largest number of flows.
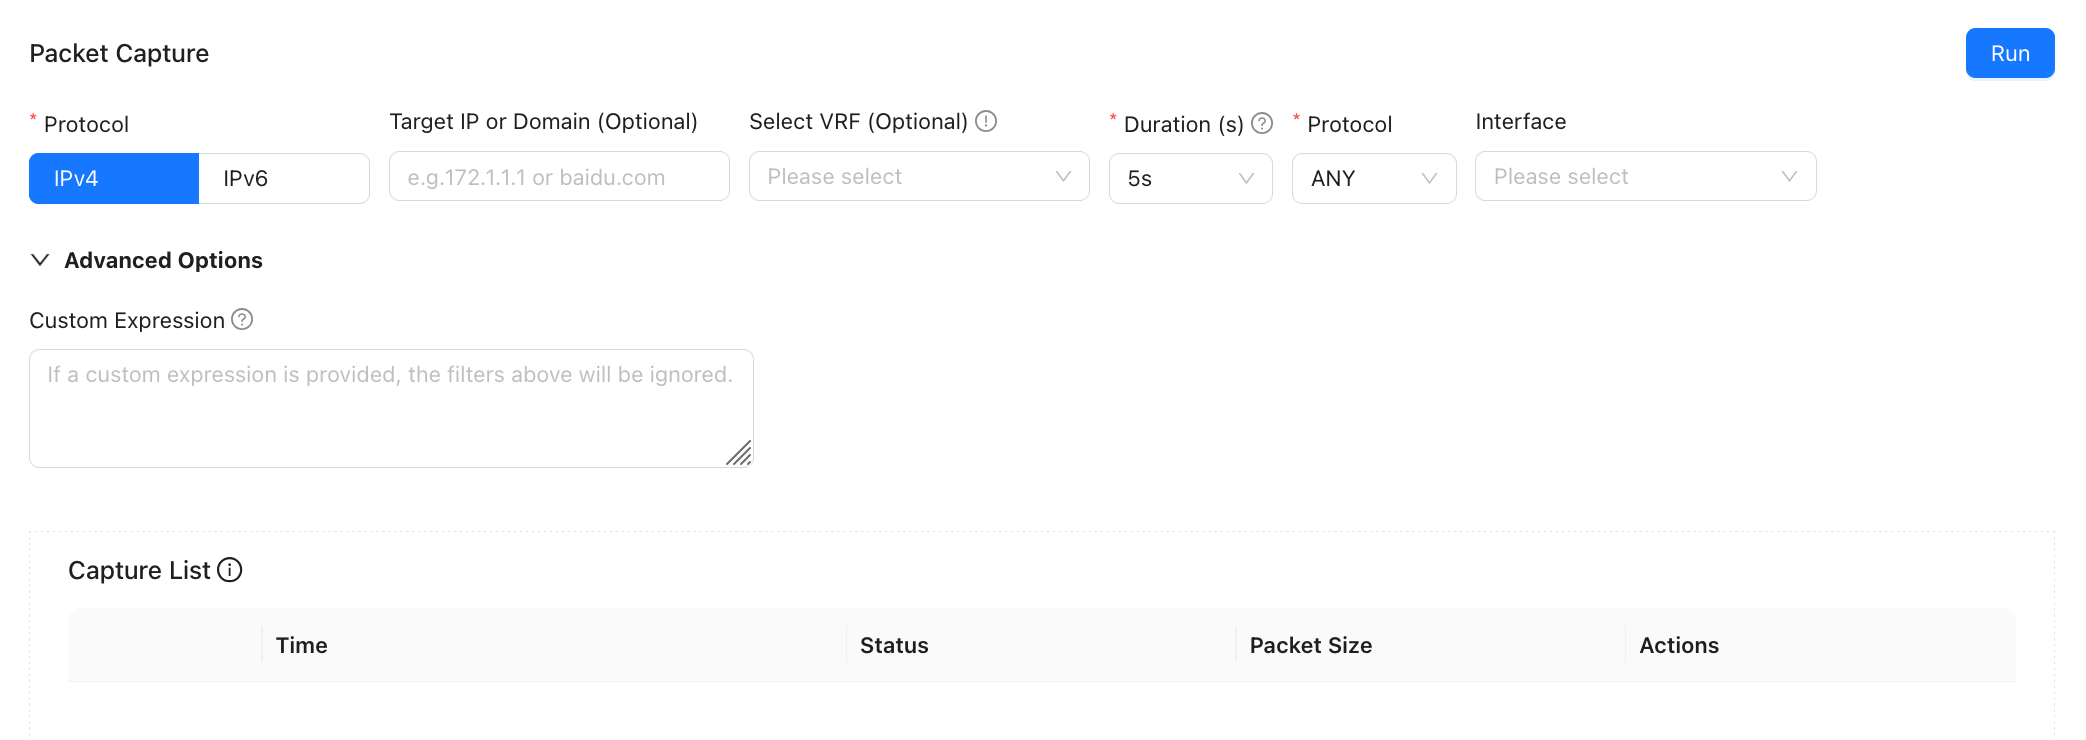
Packet Capture
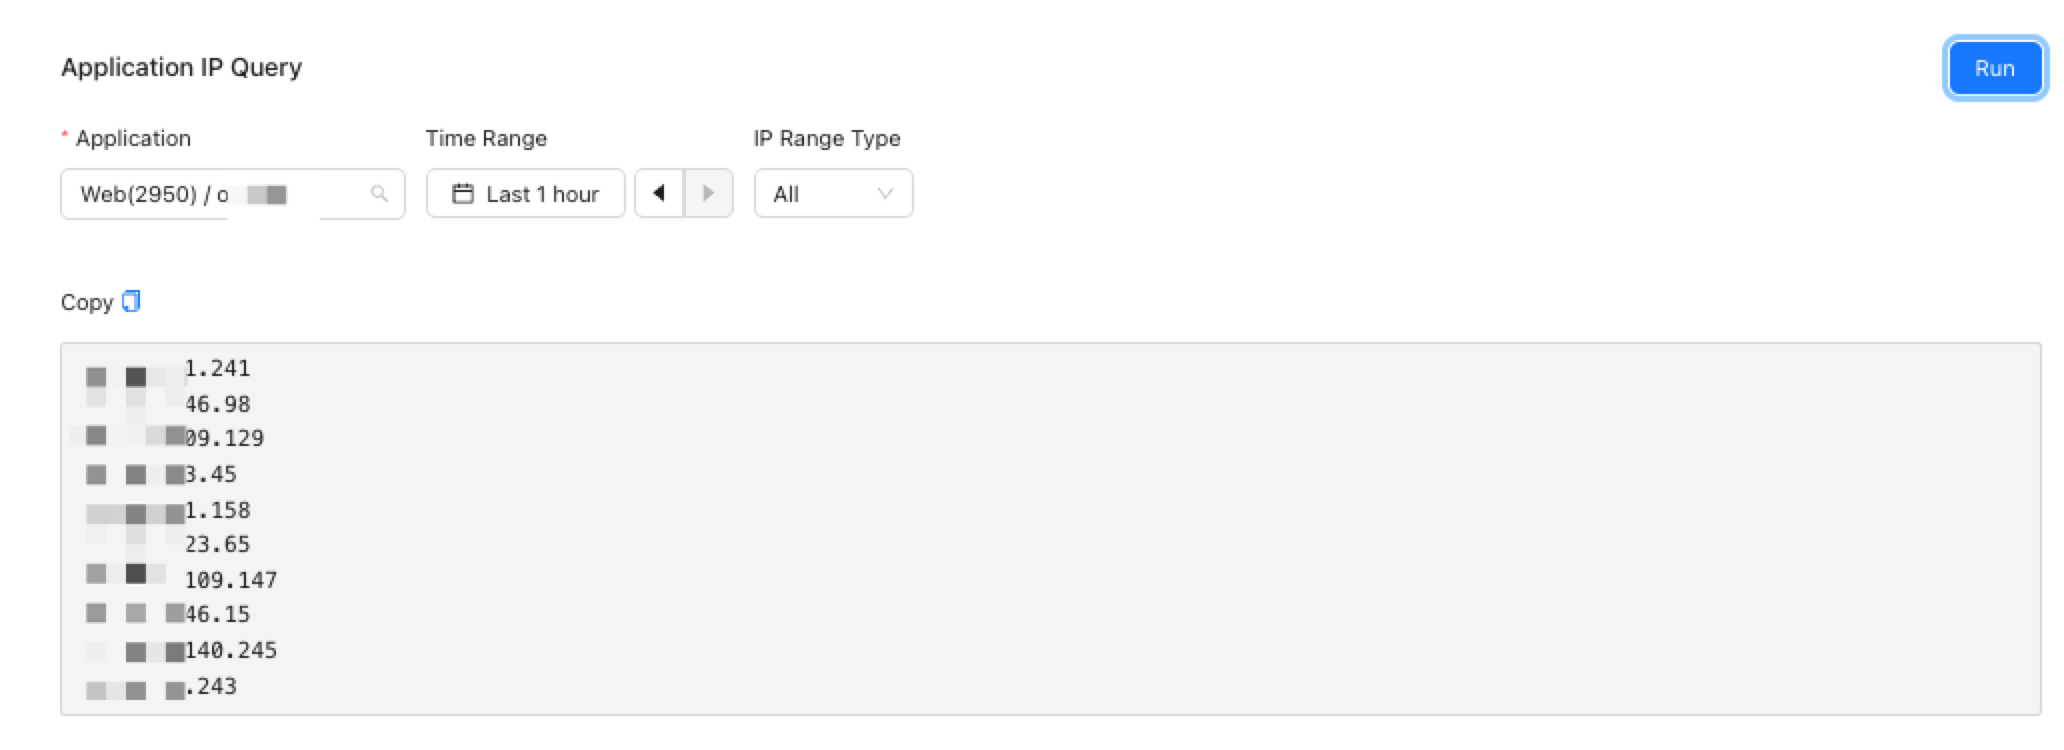
Application IP Query
Queries destination IP records for preset applications accessed by this site. Preset applications are configured in Preset Applications. The query range cannot exceed one month.
Policy Hits
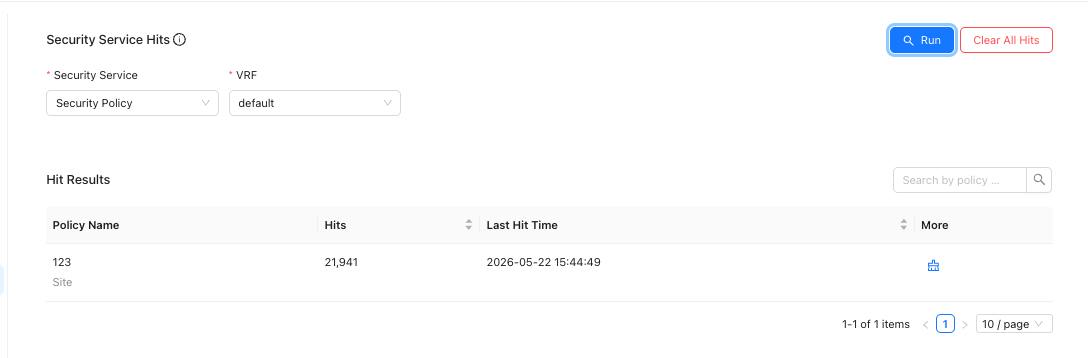
Security Service Hits
Path: Site Detail → Operations → Diagnosis → Policy Hits → Security Service Hits
- The device version must be 6.4.0 or later.
- Function: Query or clear cumulative hit counts for security services.
- Security services include security policy, address blacklist, address whitelist, domain blacklist, domain whitelist, and batch black IP blocking.
- Query Security Service hits
In the Security Service Hit Count area, select "Security Service" and "VRF", and then click "Run".
- Clear hits for a specified Security Service
In the query results, click "Clear" for the specified entry.
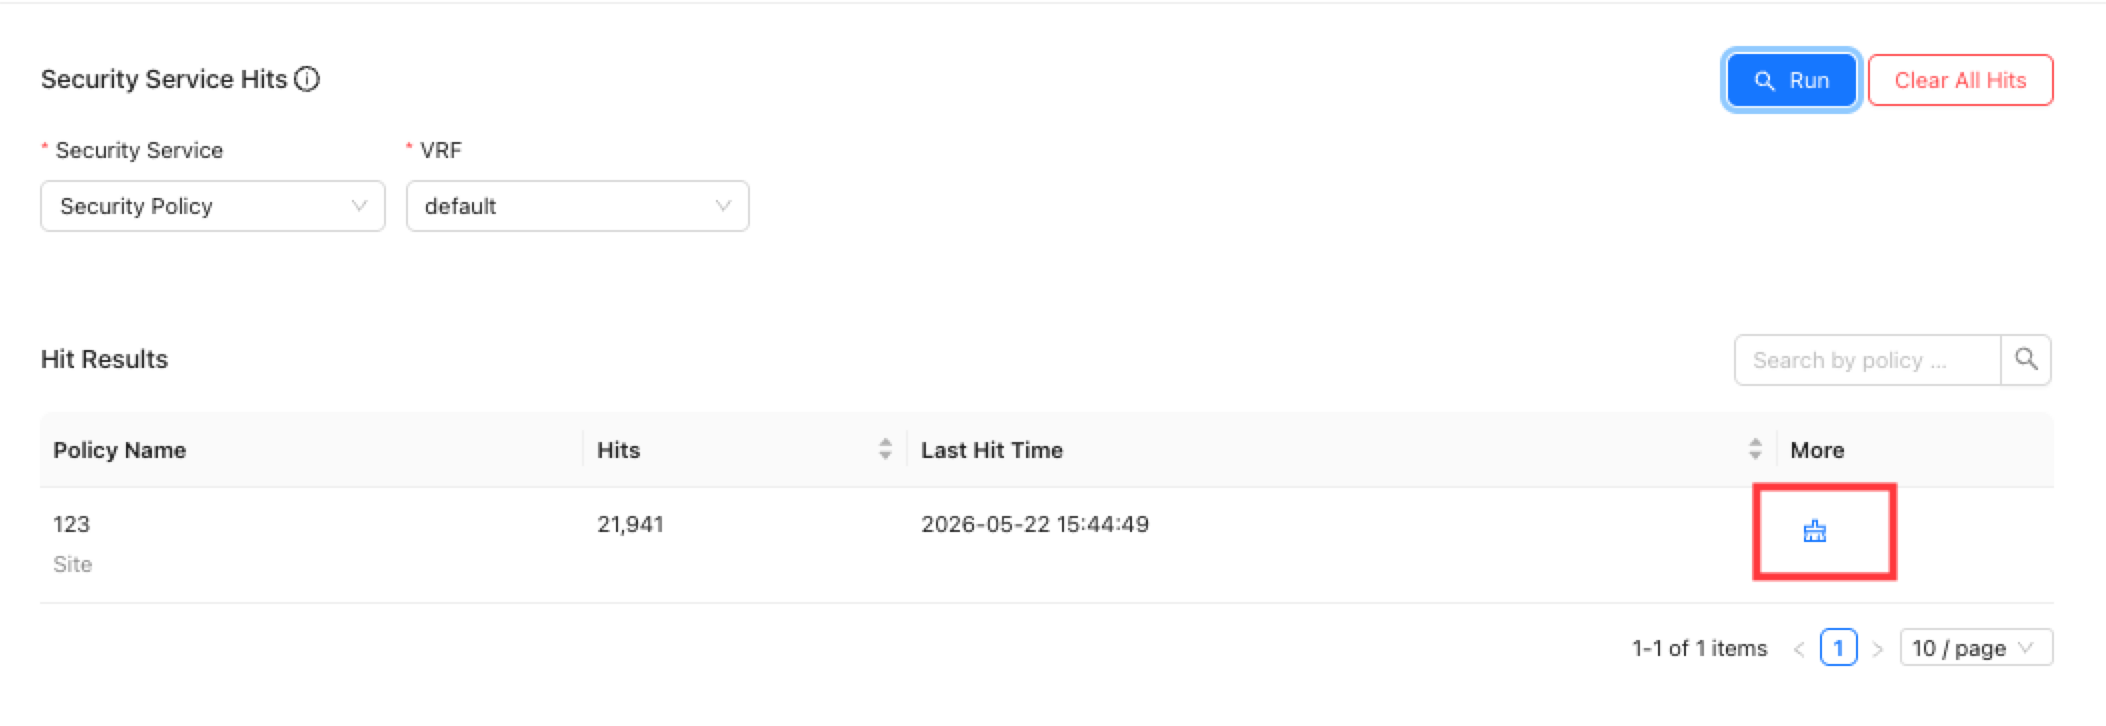
The hit count of this entry is cleared to zero.
- Clear all Security Service hits
Click "Clear All Hits".
The hit counts of all entries are cleared.
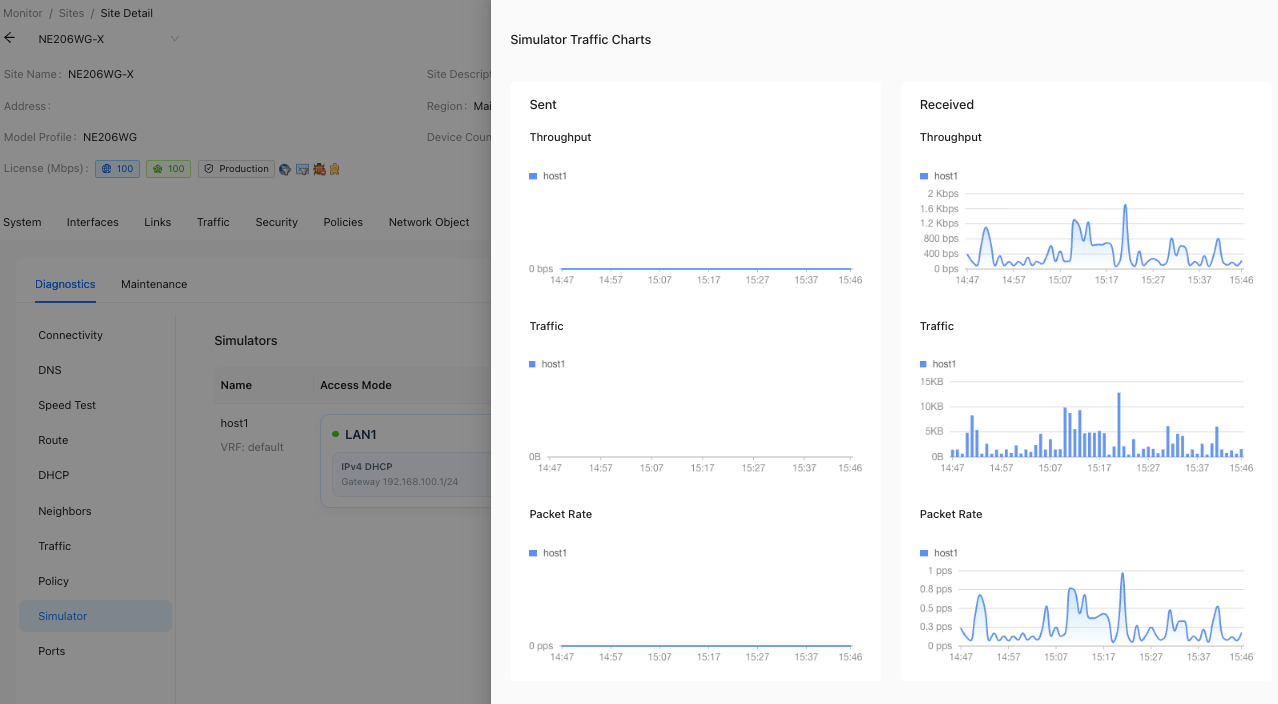
Emulator
The device can create a simulator to emulate host behavior. It is used to run operations commands and verify business policies, QoS, and security policies. With the simulator, you can quickly verify and test network policies without using real endpoint devices.
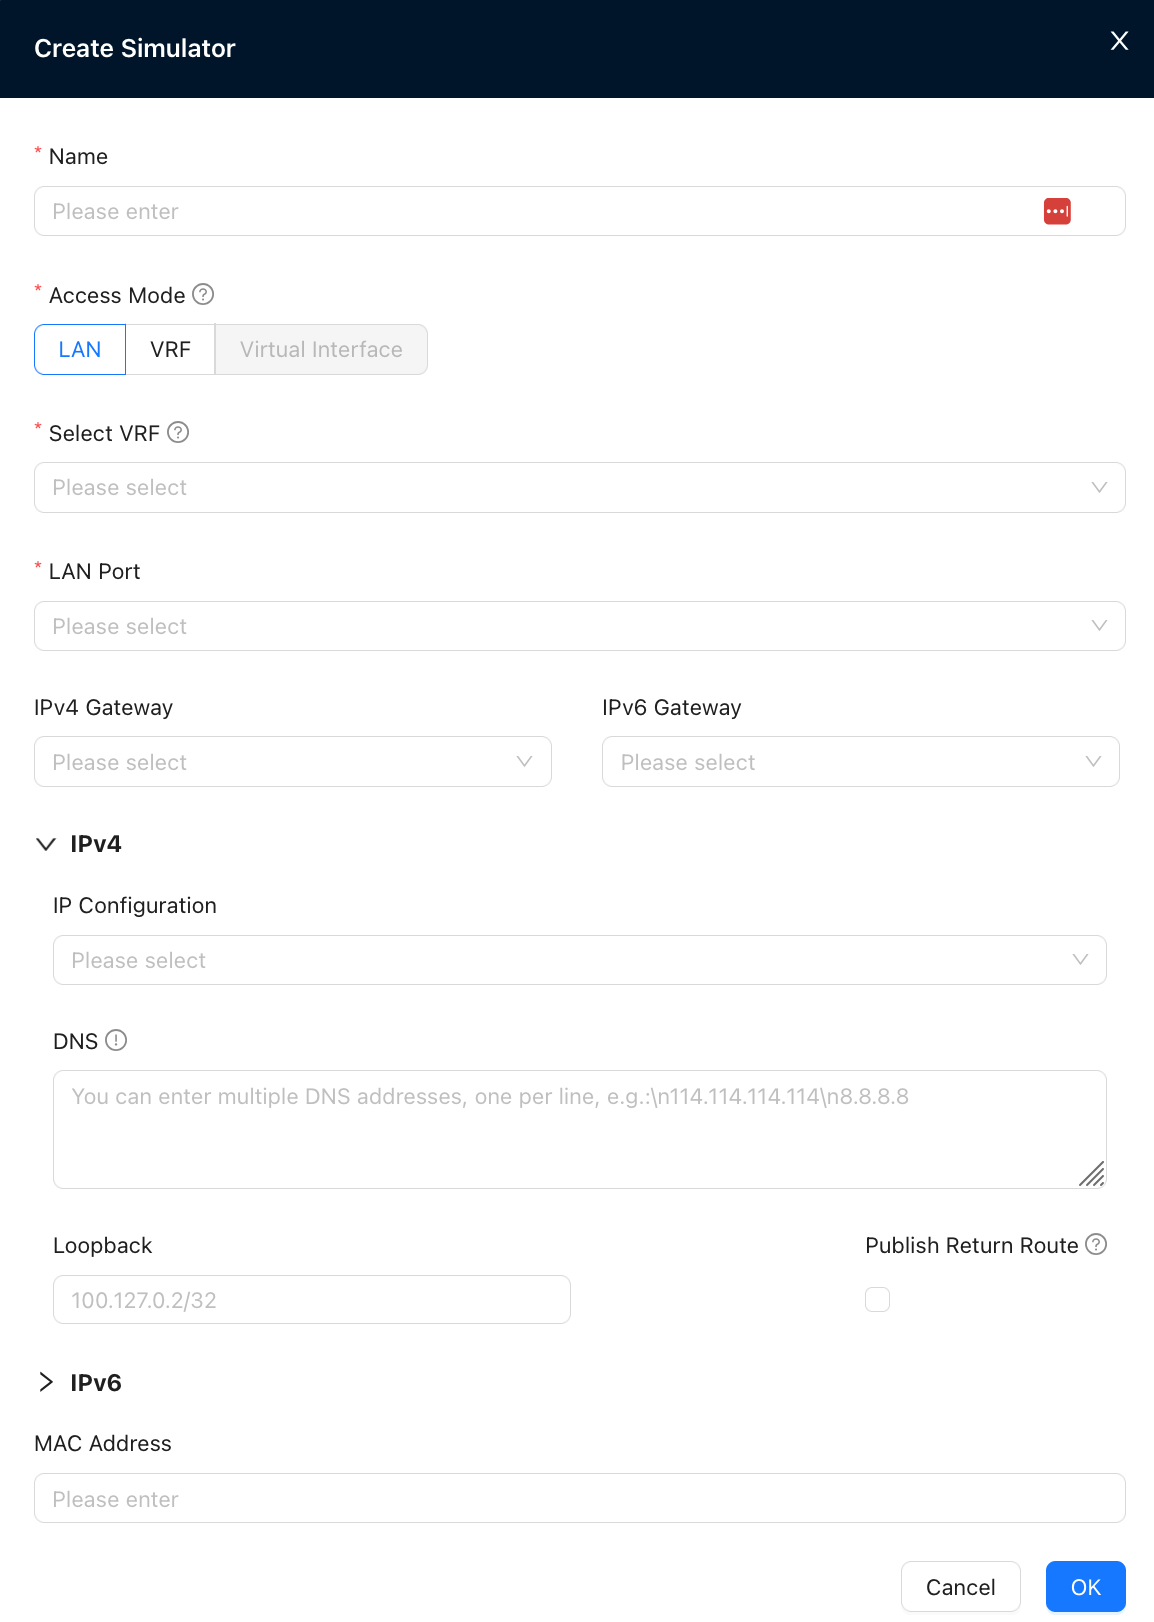
Simulator Mode
The current simulator supports three access methods:
LAN Mode
- Similar to the original normal mode, the simulator virtual interface (veth) is mounted under the specified LAN port.
- Supports DHCP / static IP configuration.
- Supports IPv4 / IPv6 address, gateway, MAC address, DNS, and Loopback address configuration.
- Suitable for business verification scenarios that require simulated LAN endpoints.
VRF Mode
- Similar to the original One-arm mode, the simulator veth connects directly to the VRF without going through the LAN port.
- Supports only Loopback address and DNS configuration.
- Supports IPv4 / IPv6 DNS and Loopback address configuration.
- Suitable for policy verification in a VRF-isolated environment.
Virtual Interface Mode
- Associated with transparent mode. The simulator veth is mounted on the Layer 2 bridge.
- Must reference the virtual link configured at the site.
- Supports DHCP / static IP configuration.
- Supports gateway, IP, MAC address, DNS, and Loopback address configuration.
- IPv6 is not supported yet.
- Suitable for business connectivity simulation in transparent forwarding scenarios.
Other Notes
- A return route is automatically added for the Loopback address by default. You can choose whether to advertise it.
- If no DNS address is configured, operations commands that depend on the simulator must use the target IP address instead of the domain name.
- The device software version must be 6.2.0 or later.
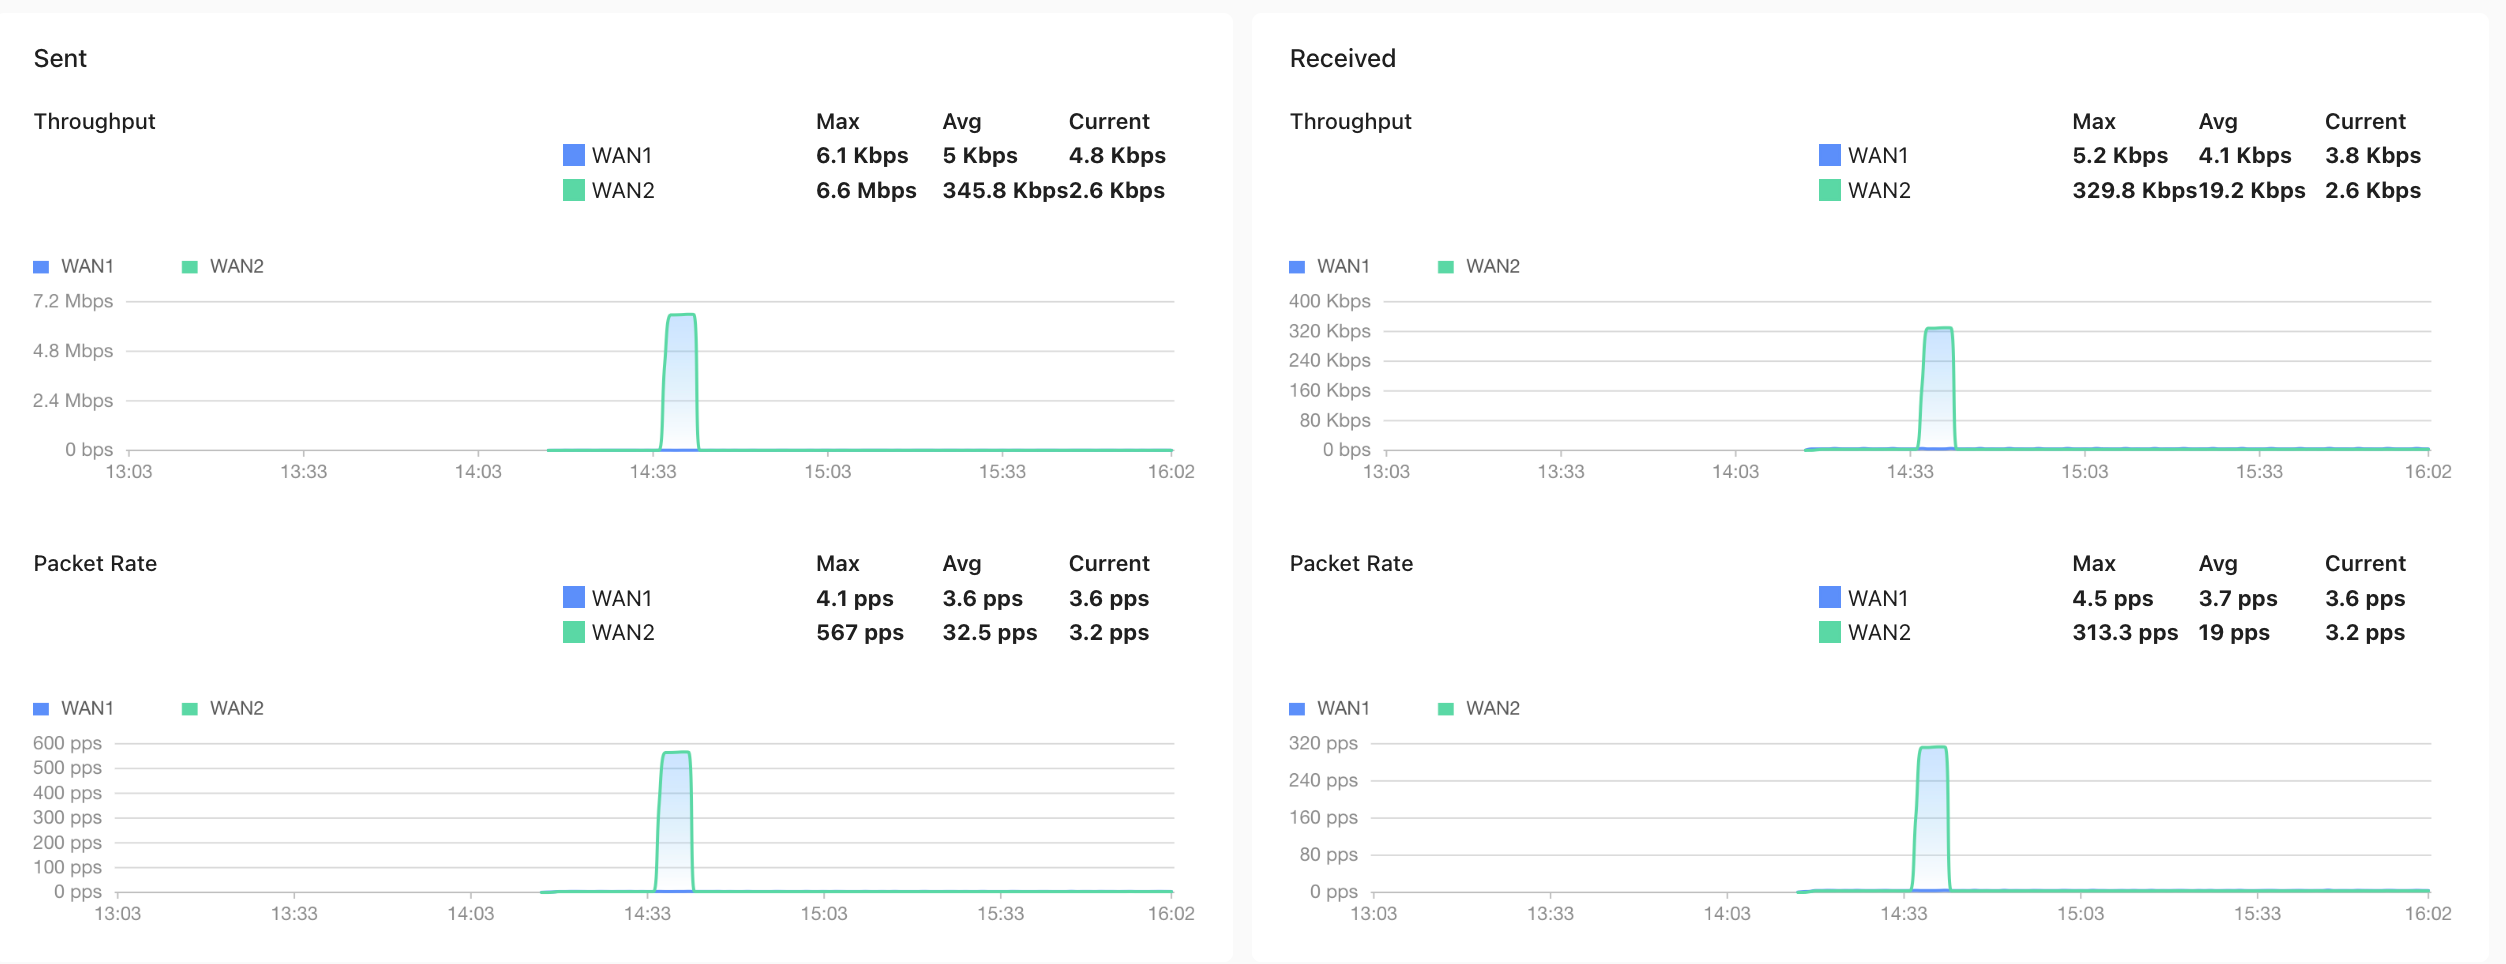
- You can view runtime statistics such as throughput, traffic, and packet rate for the simulator.
Interface
Optical module information
When an optical module is inserted into the device, you can query its interface, serial number, product model, vendor, receive optical power, transmit optical power, and other information on this page.
Maintenance
Path: Monitor → Sites → Site Detail → Operations → Maintenance
- Site maintenance tools.
- Includes device restart, password retrieval, device upgrade, remote login, maintenance mode, and Disable NUMA.
Disable NUMA
Disabling NUMA requires the following conditions:
- The device model is NE900.
- The device is in multi-NUMA-node status.
- Security protection capabilities are enabled.
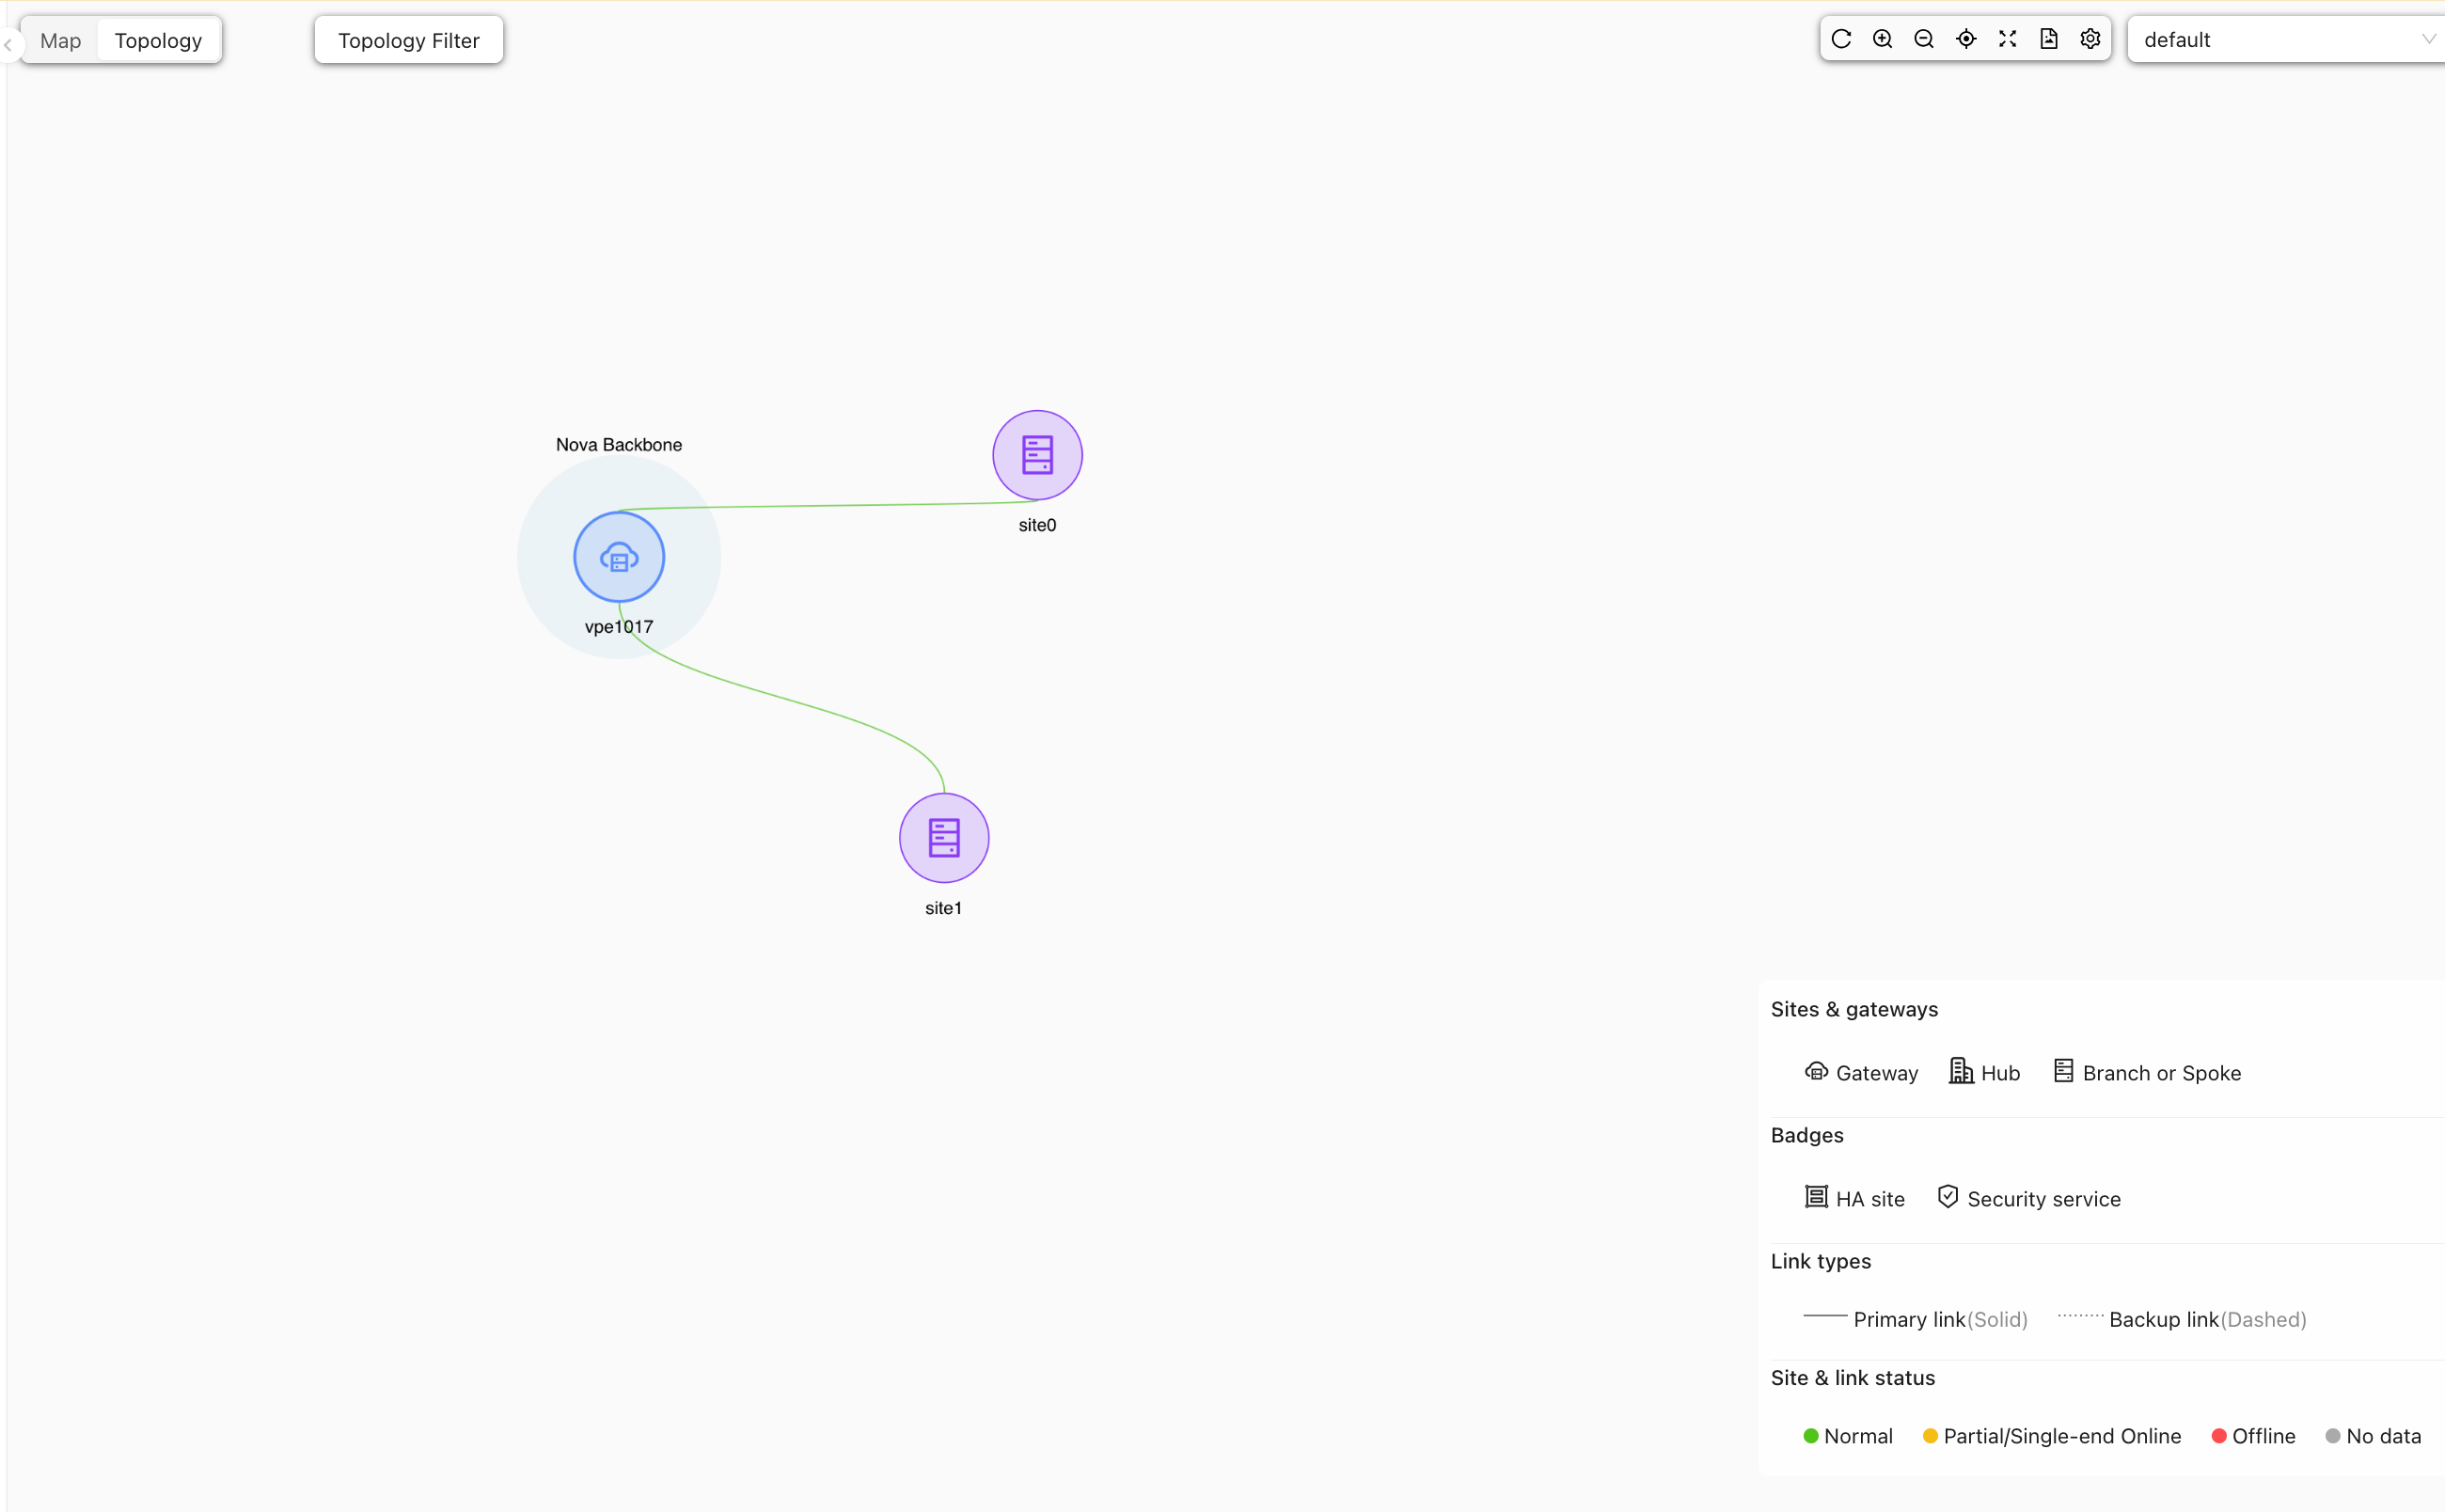
Site Topology
Tenant > Monitor > Sites > Topology
Topology View
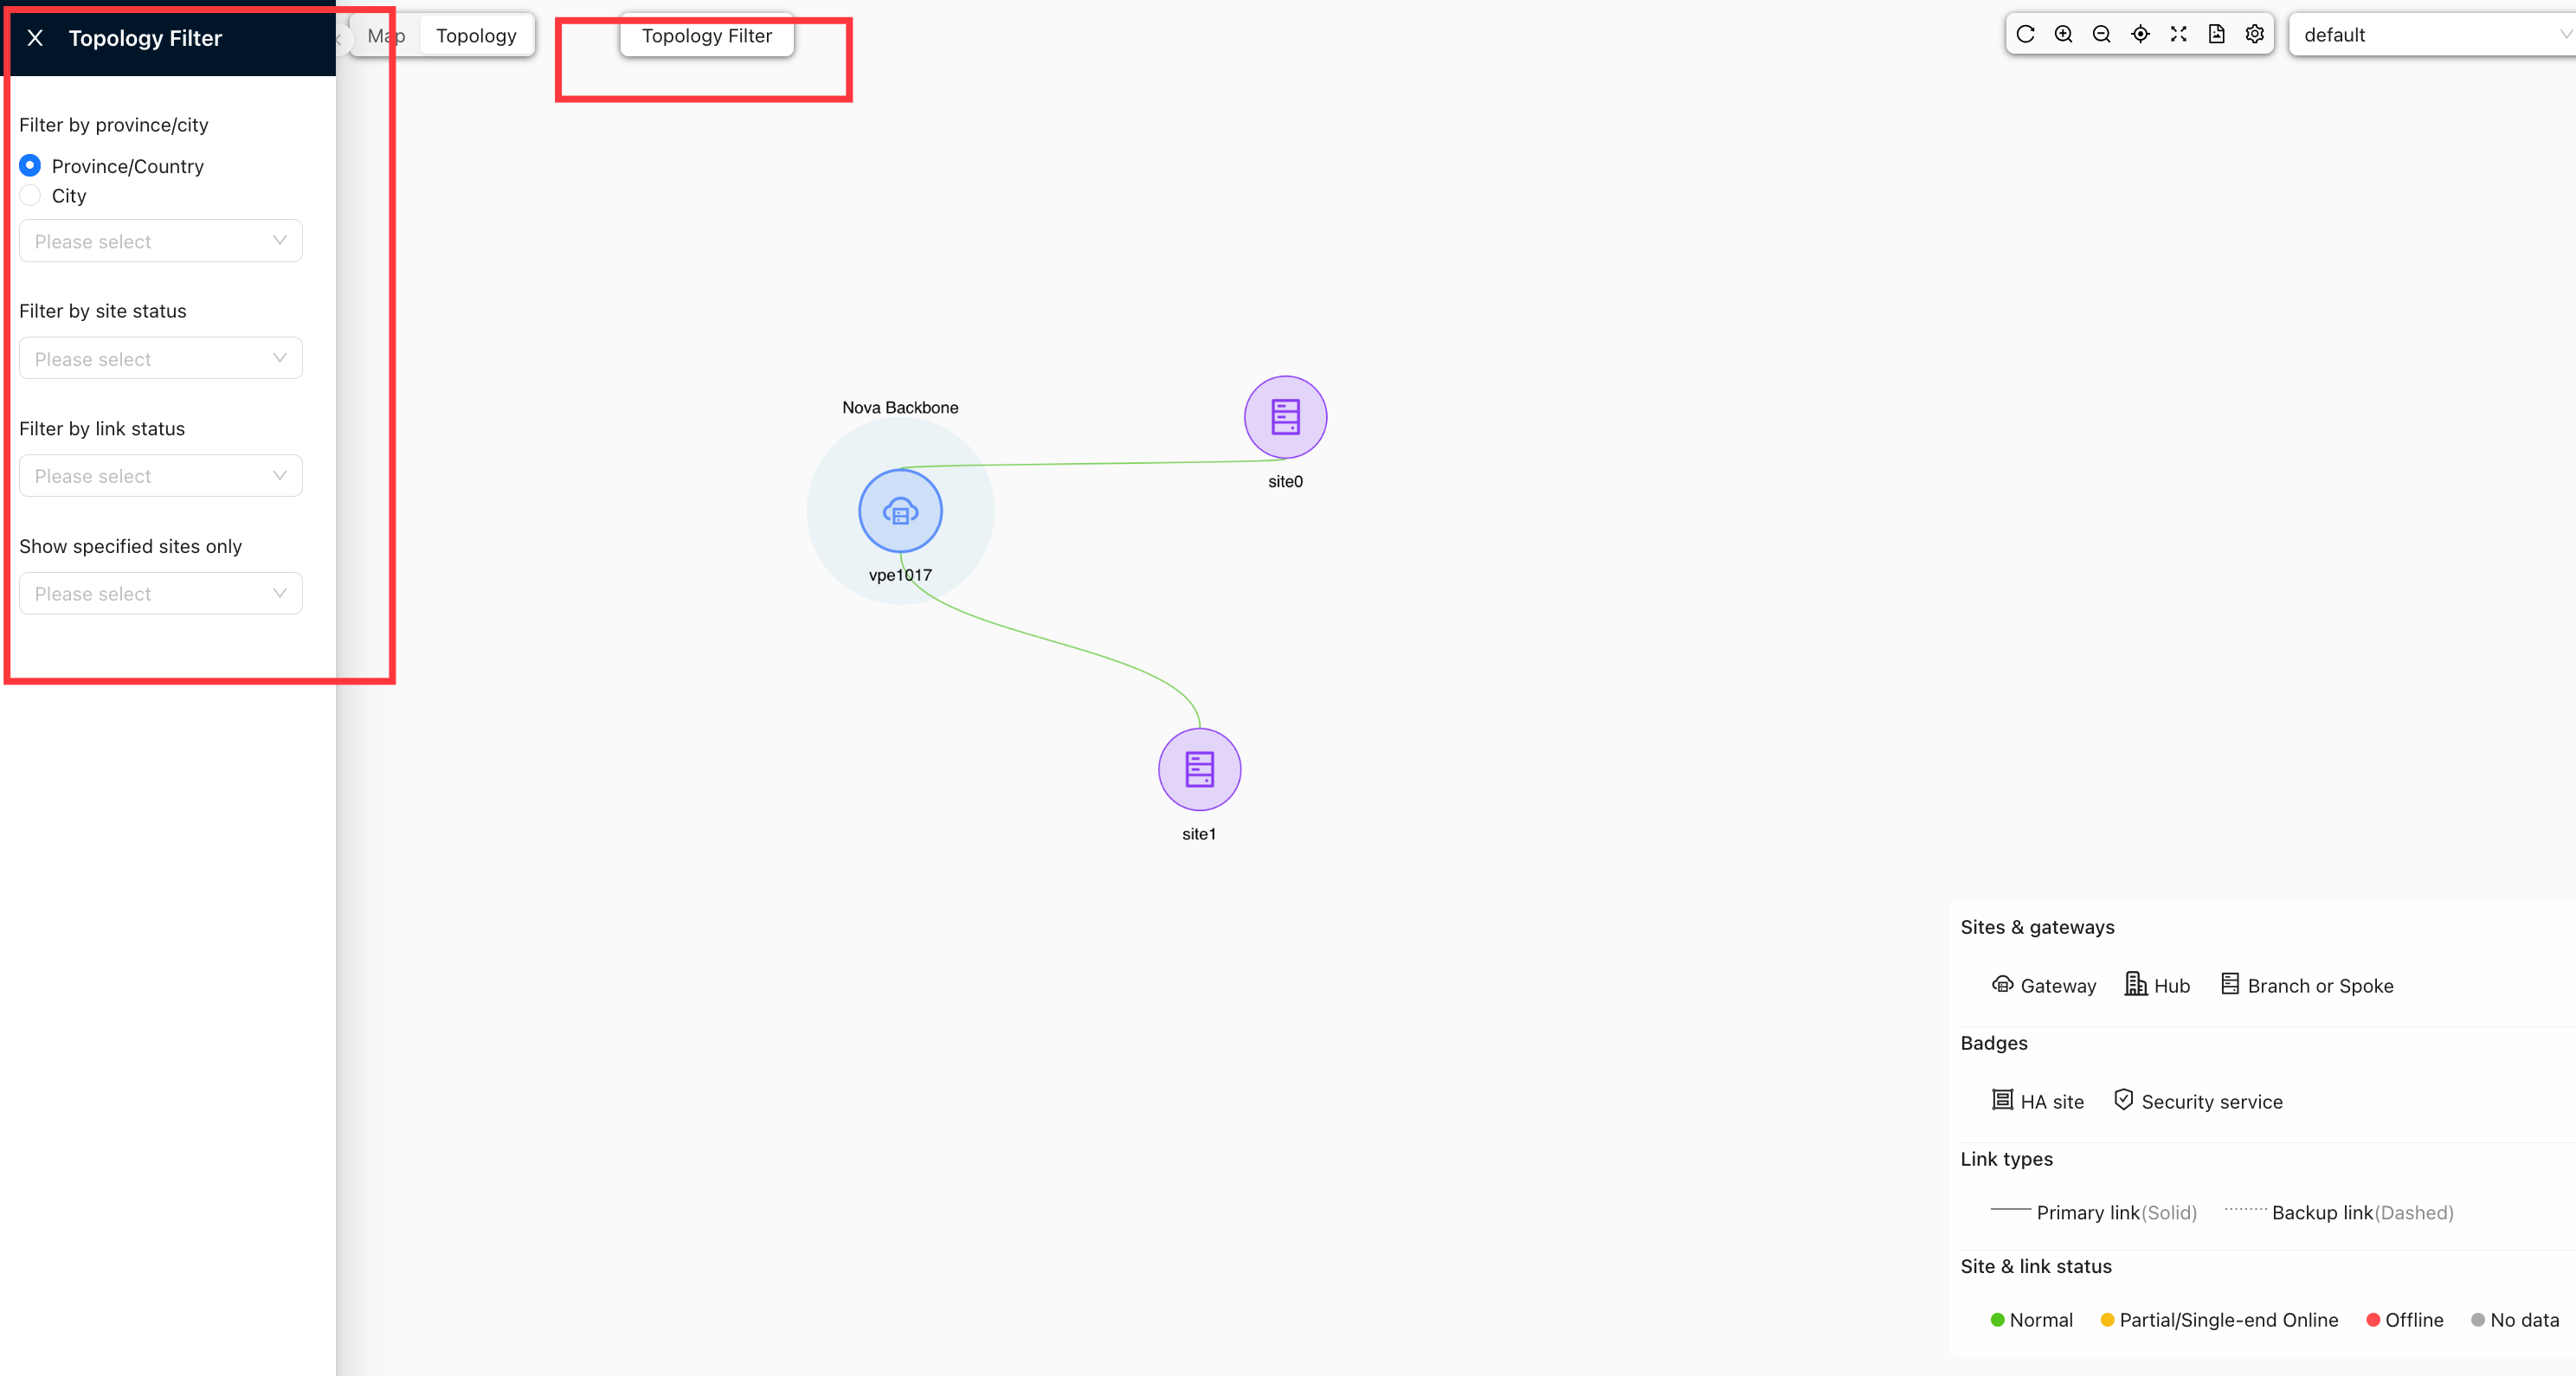
Topology Filtering
Link Diagnostics
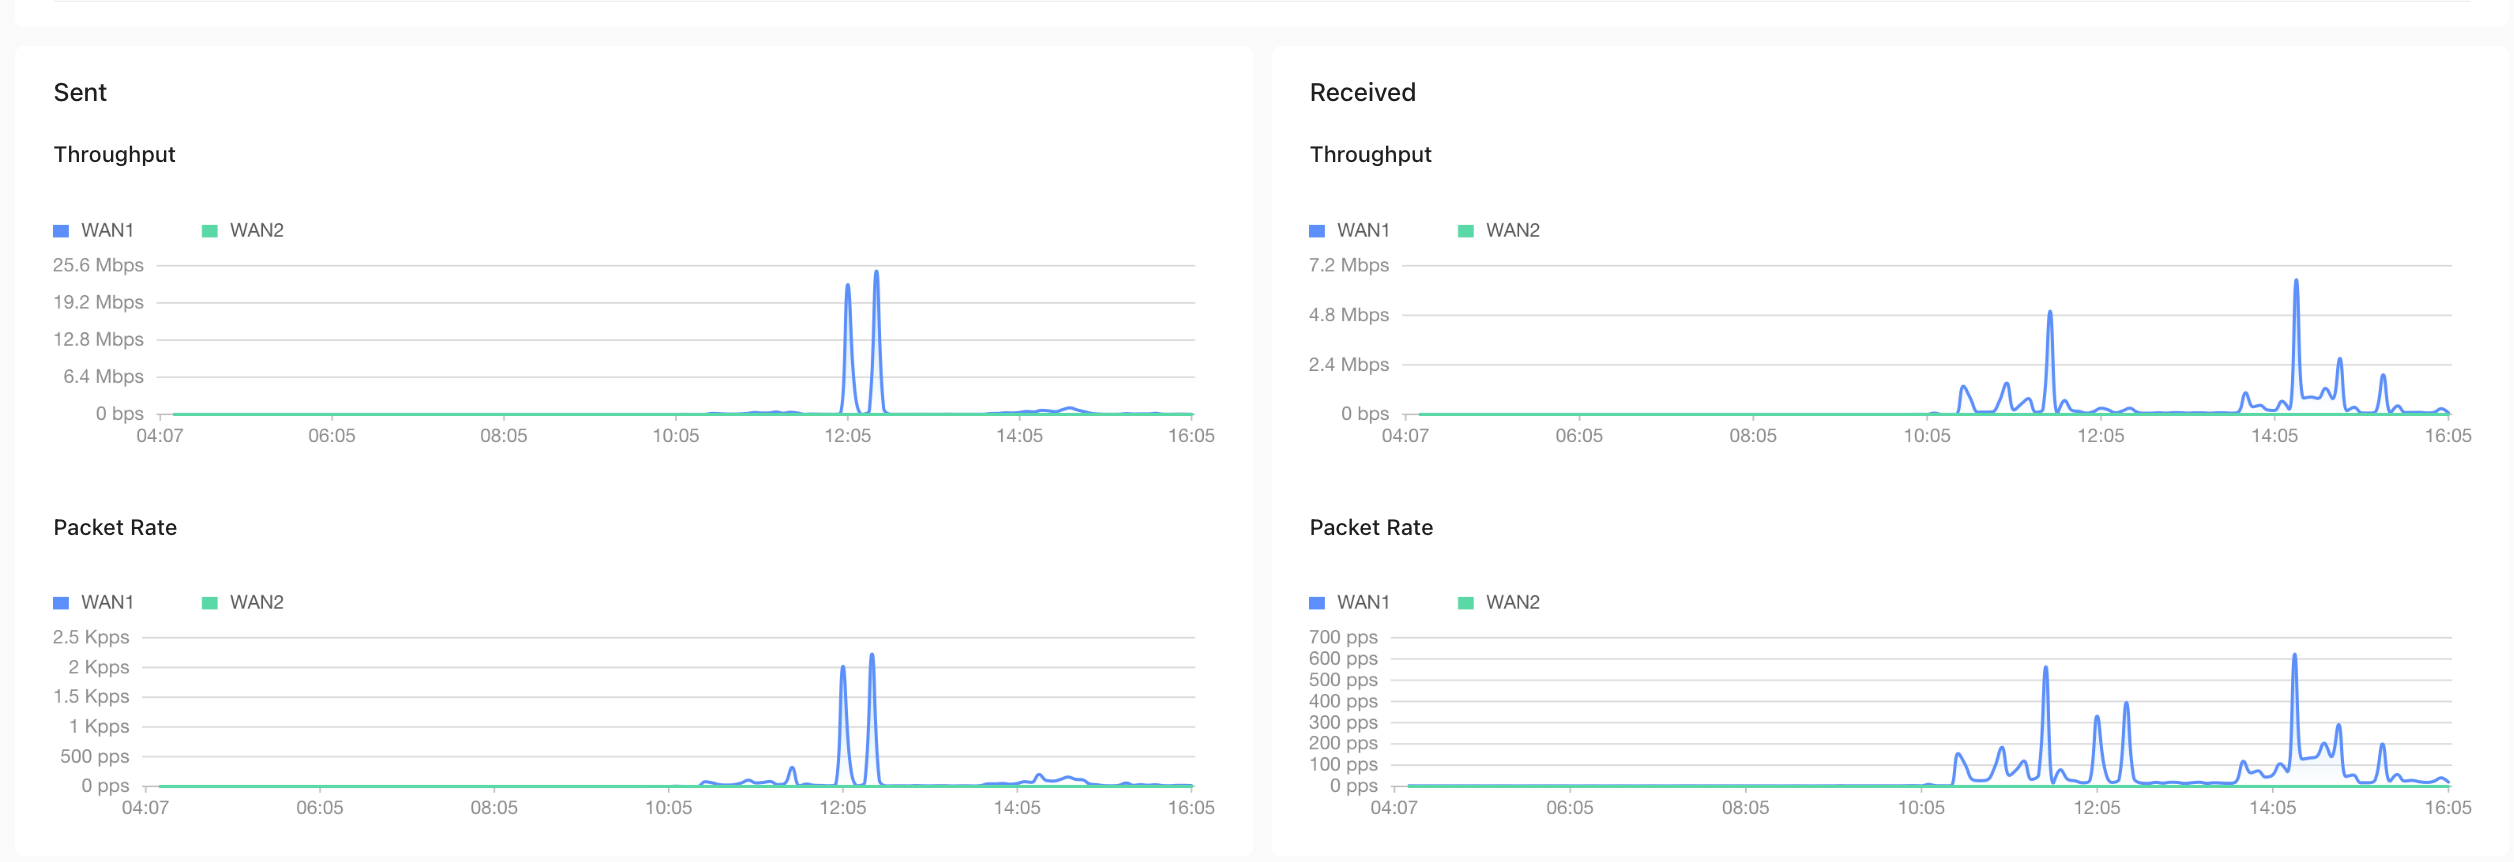
Tenant > Monitor > Sites > View Site Detail > View link traffic details > Traffic Details
QoS Traffic Statistics
- Interface QoS Traffic
- Link QoS Traffic
Display Burst Bandwidth at a Specified Time
Display trend data statistics: The maximum, average, and current values of each category are listed in a table before the trend chart.
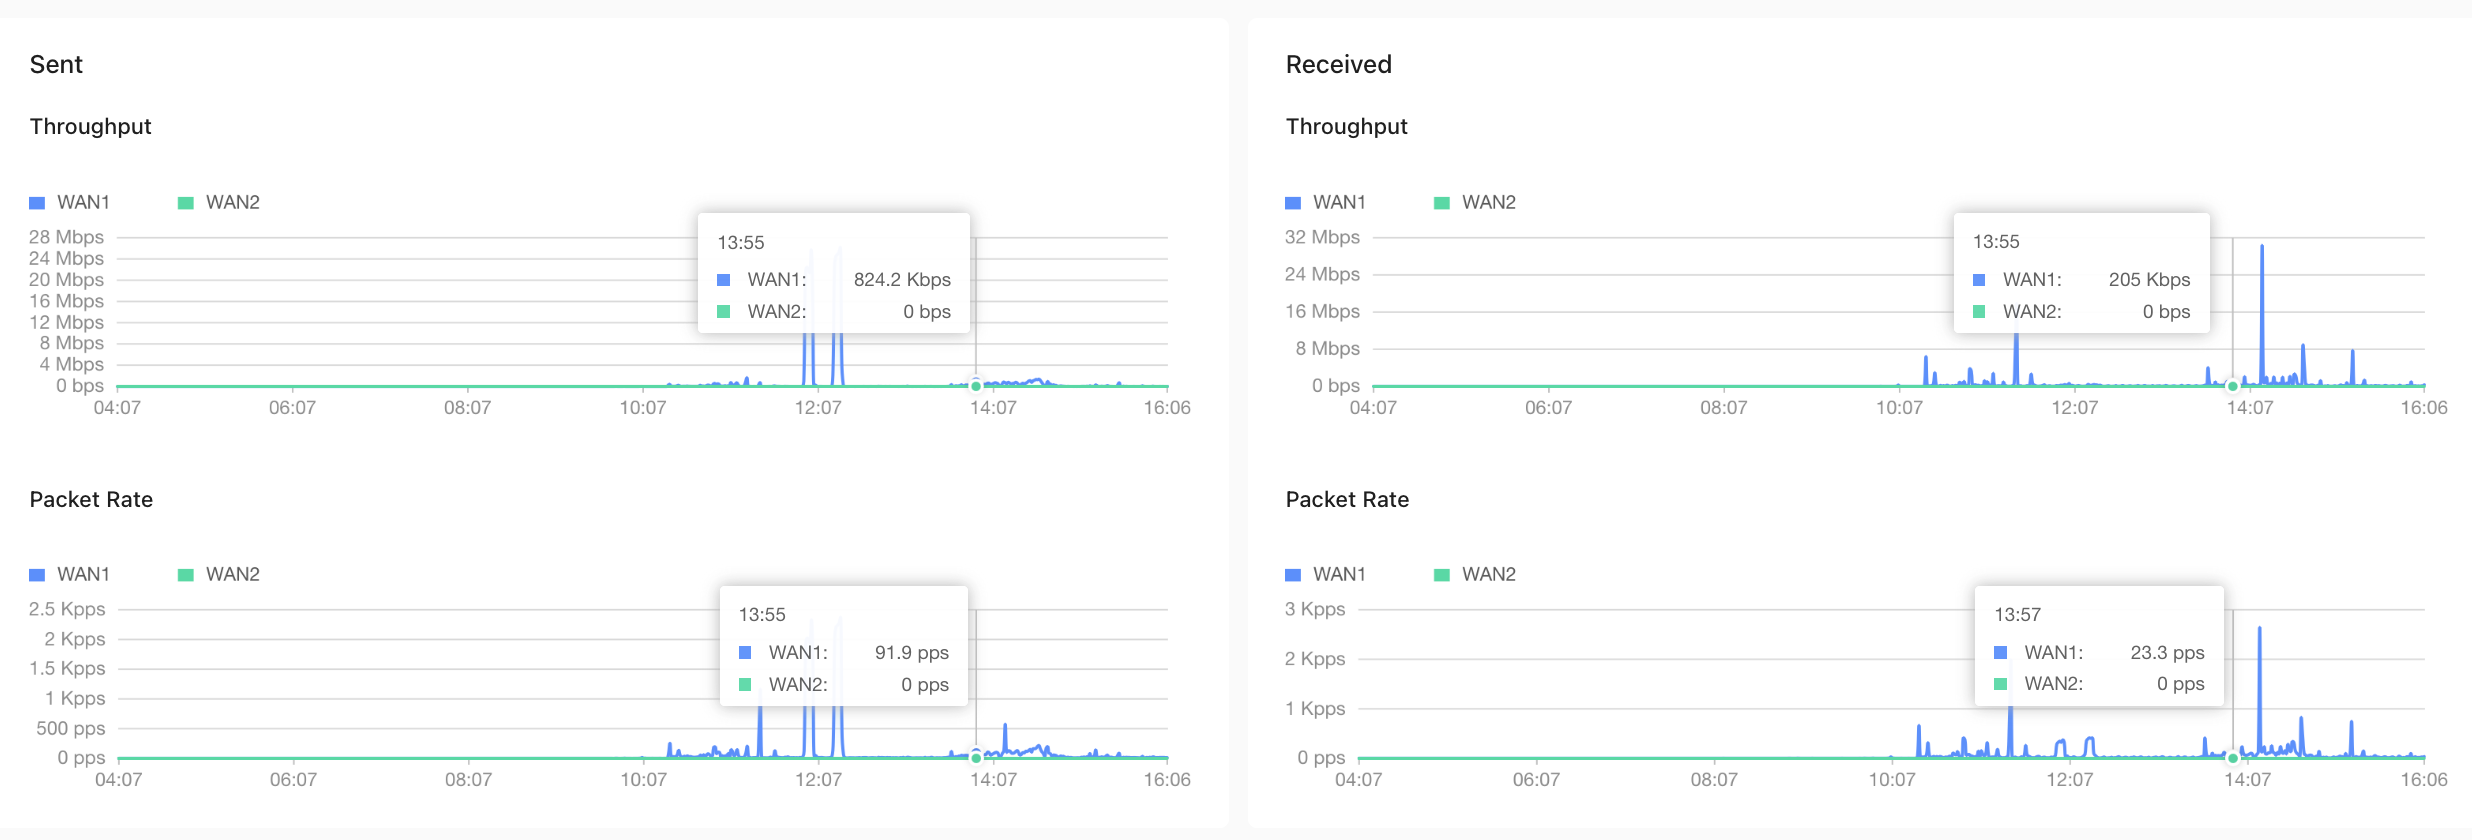
Data interval (selecting too small an interval may reduce page performance):
- Normally, the returned data interval is automatically adjusted based on the selected query time range. You can also manually specify the data interval to view more detailed or more aggregated data.
- If the query time range is within 7 days, the 1-minute data interval is available.
- If the query time range is within 31 days, the data interval can be 1 minute, 5 minutes, or 1 hour.
- If the query time range exceeds 31 days, the data interval cannot be specified.
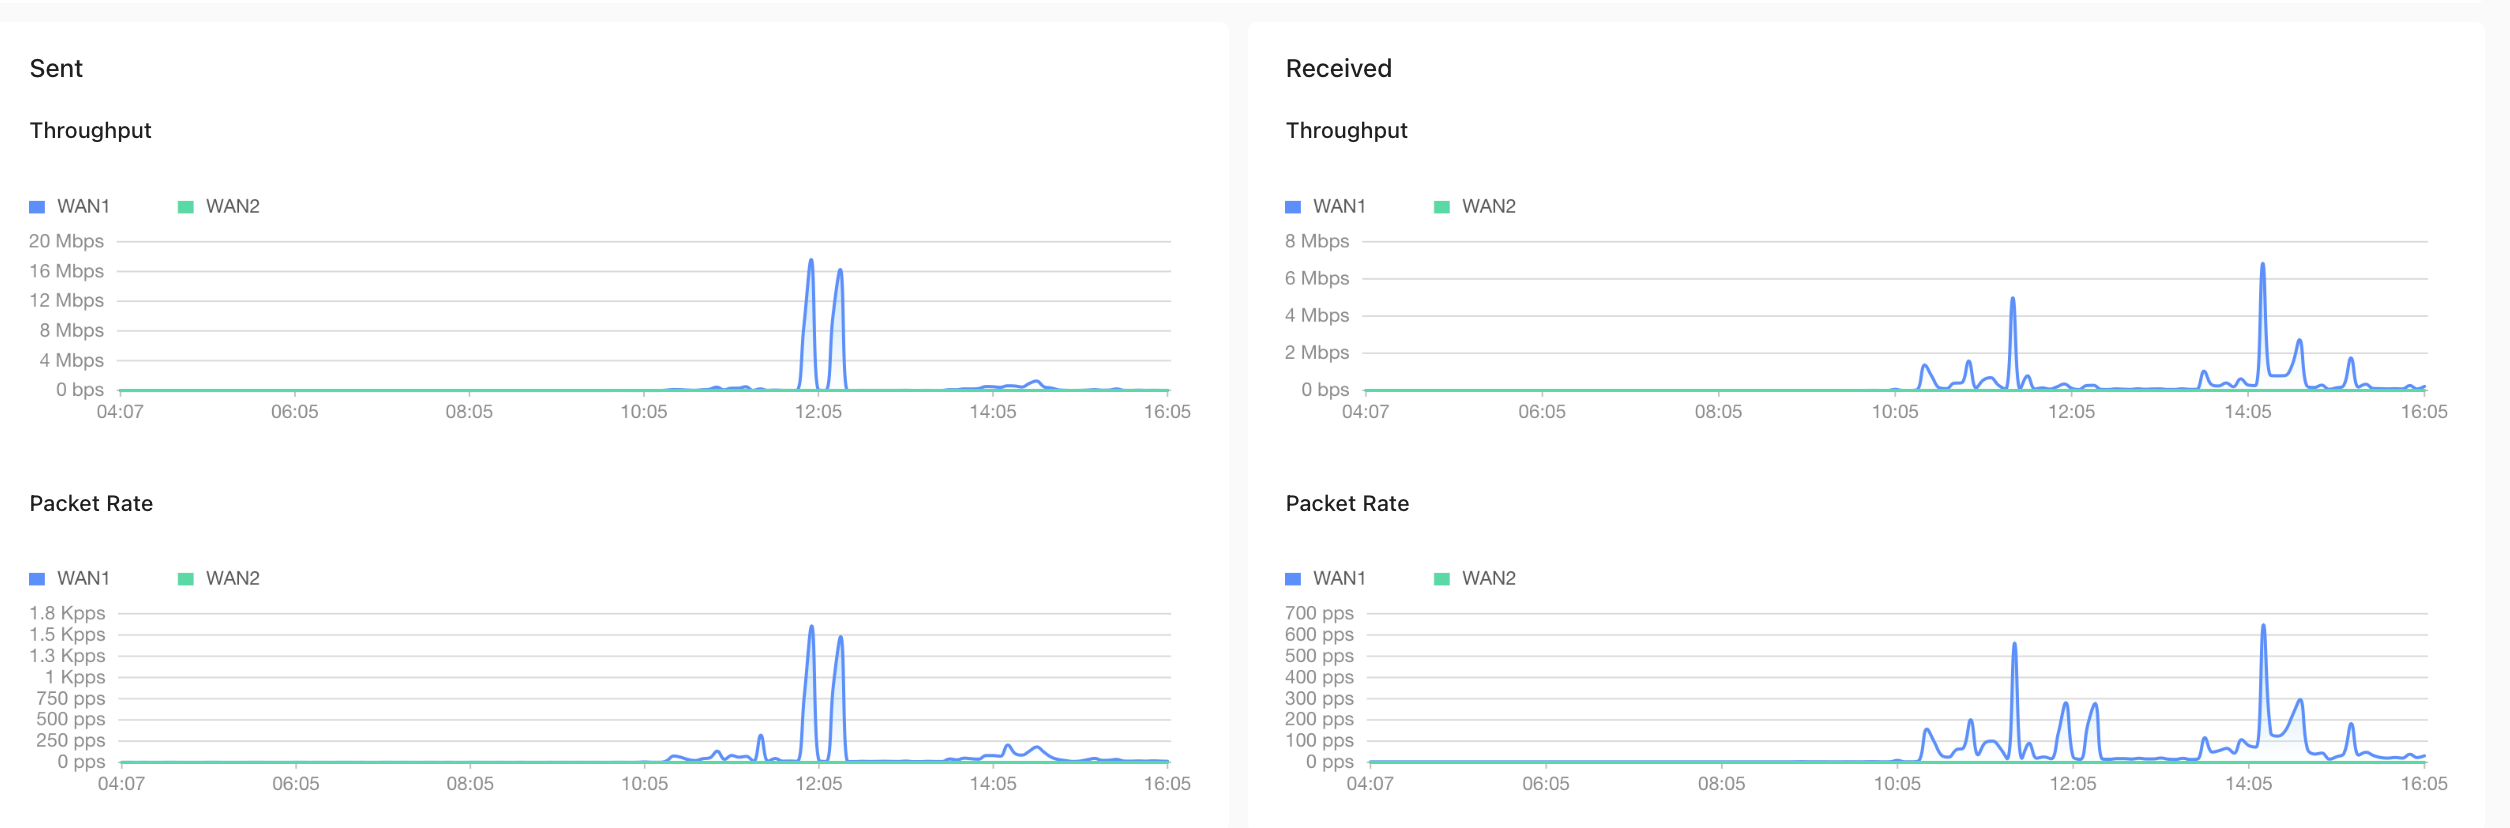
How data is aggregated:
- Typically, data is aggregated into an average within each time interval.
- You can also manually specify the aggregation method. Supported methods include average, maximum, minimum, and latest value.
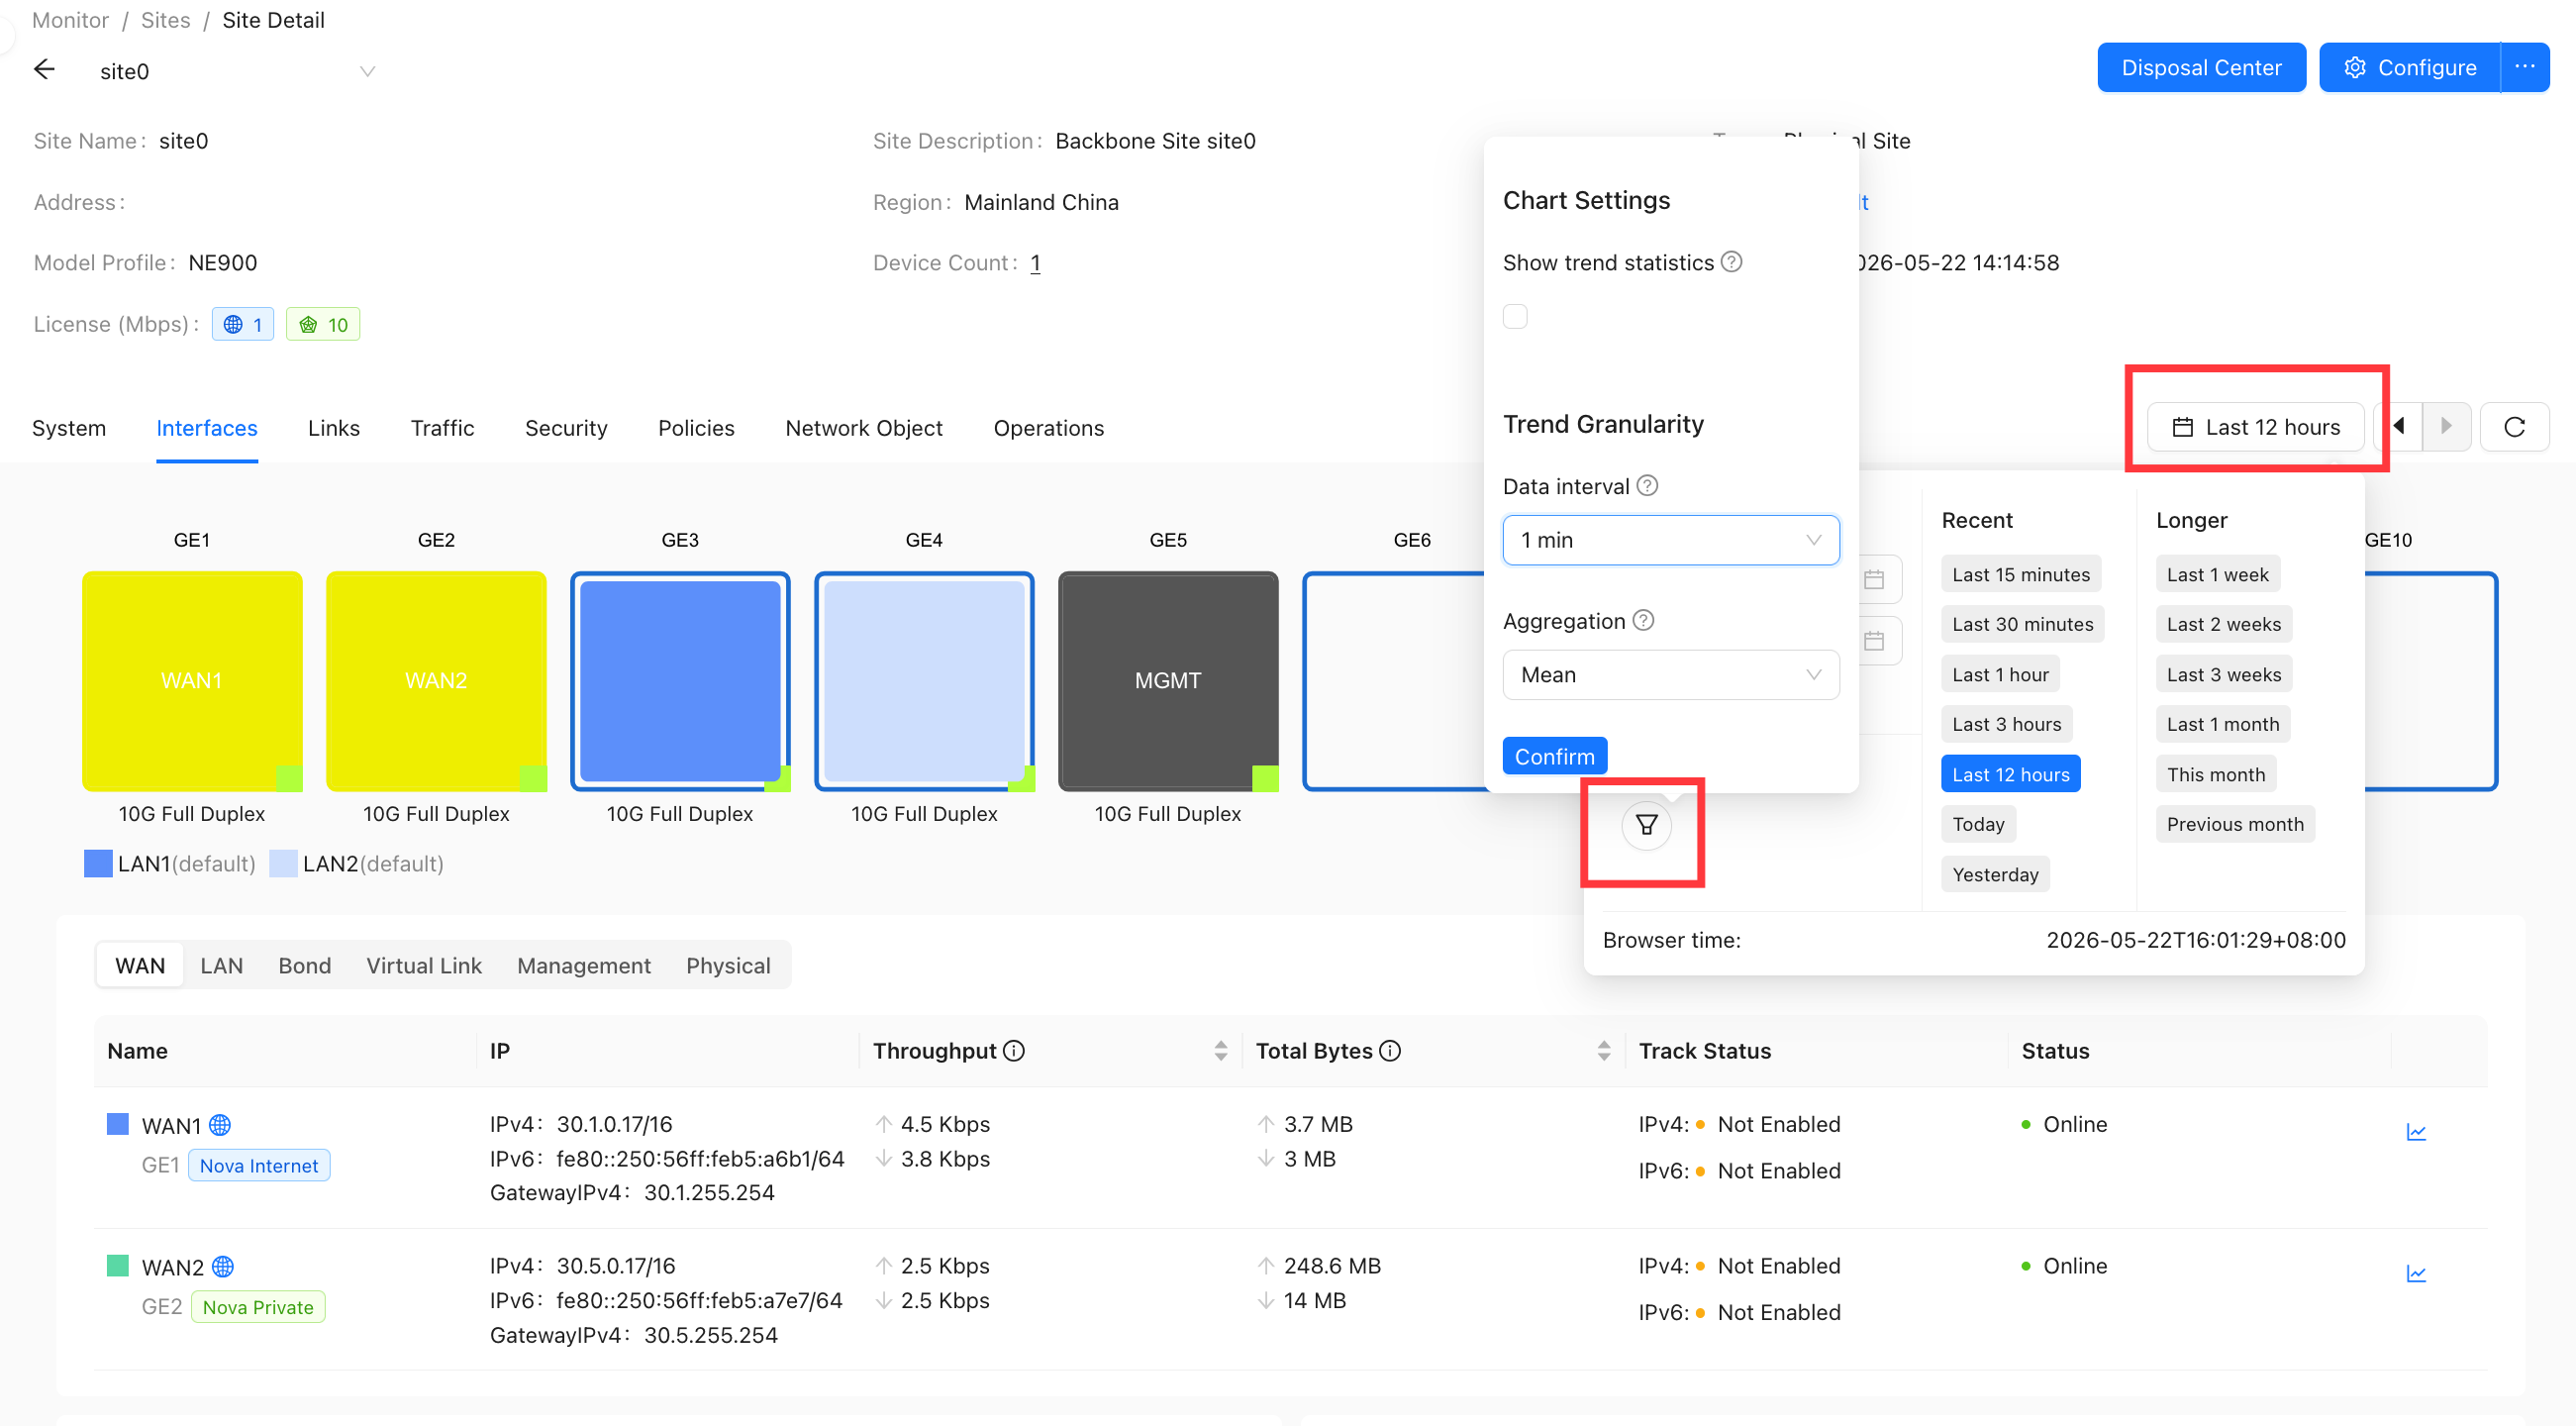
Select Chart Statistics.
- Default traffic graph
- 1-minute average traffic chart
- 5-minute average traffic chart
- 1 hour average traffic chart