Network large screen v2
Enable
Please click here to enable it
Interface description
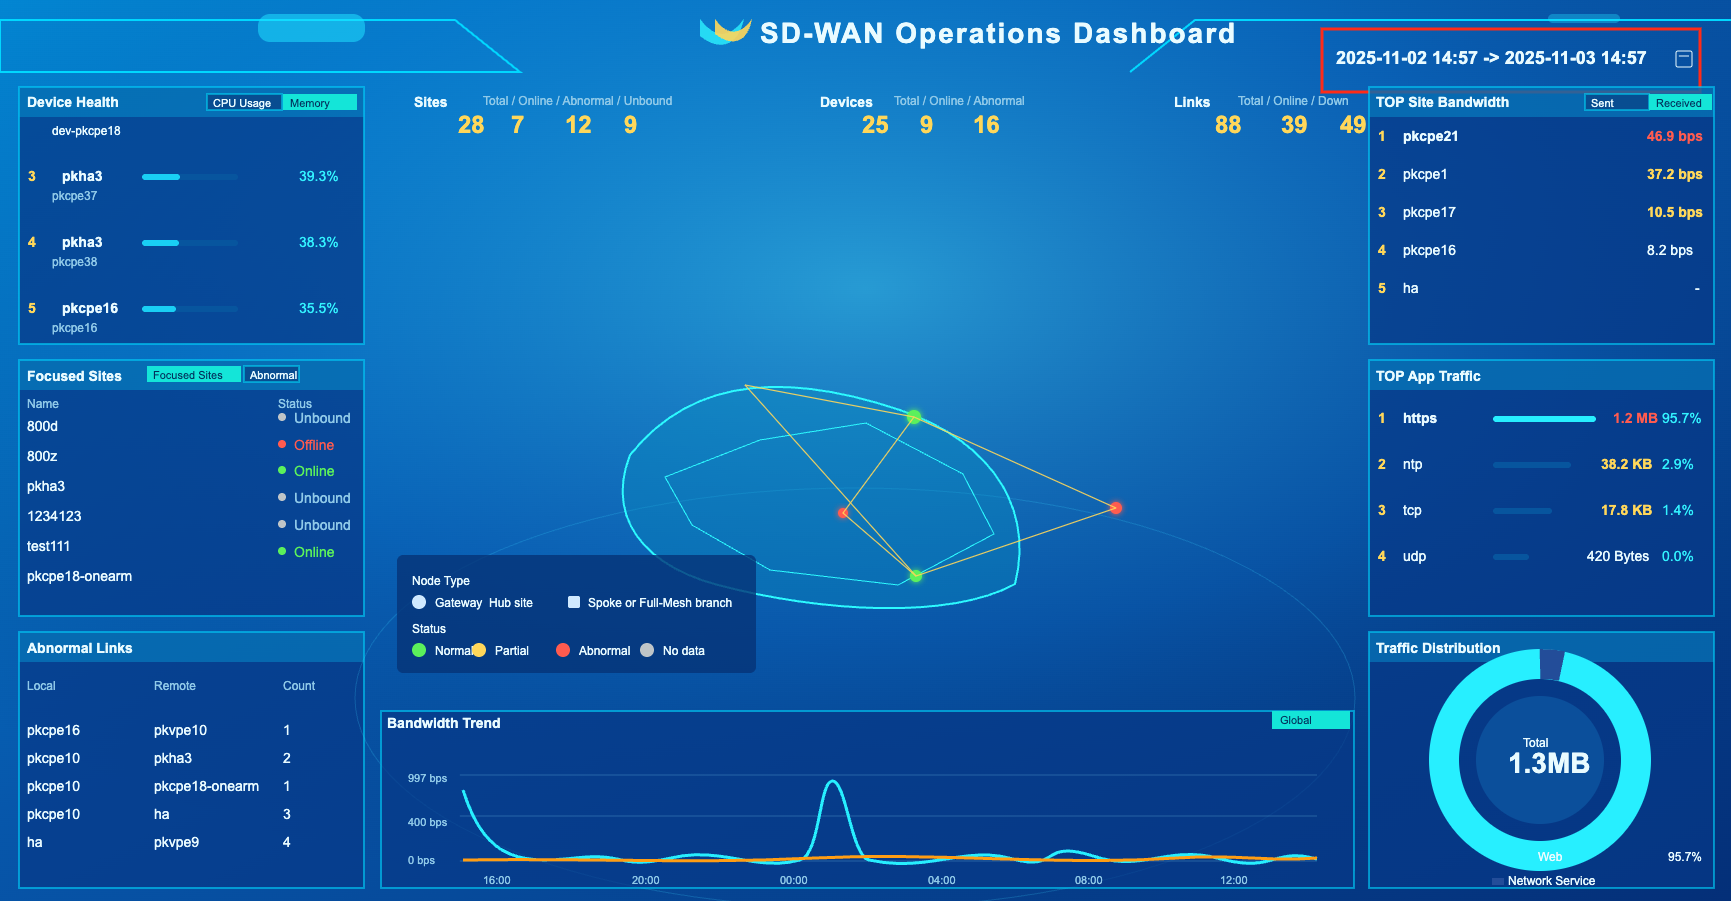
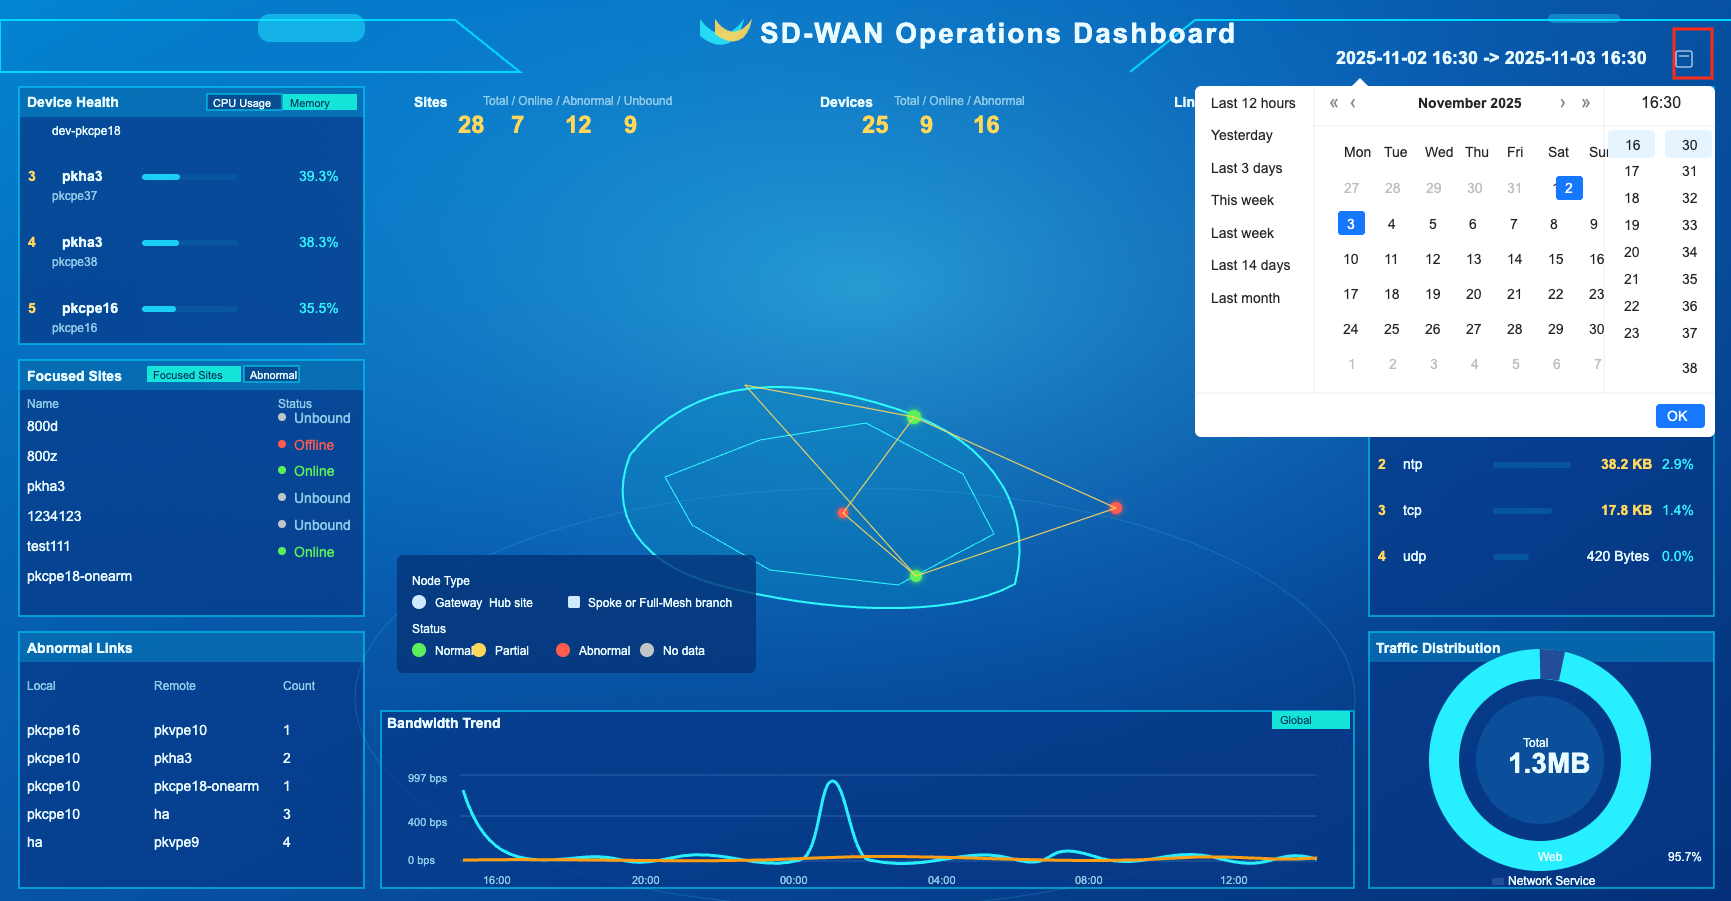
Time filter
The interface location is as shown below
Click the icon below to pop up an interface where you can set predefined and custom time ranges
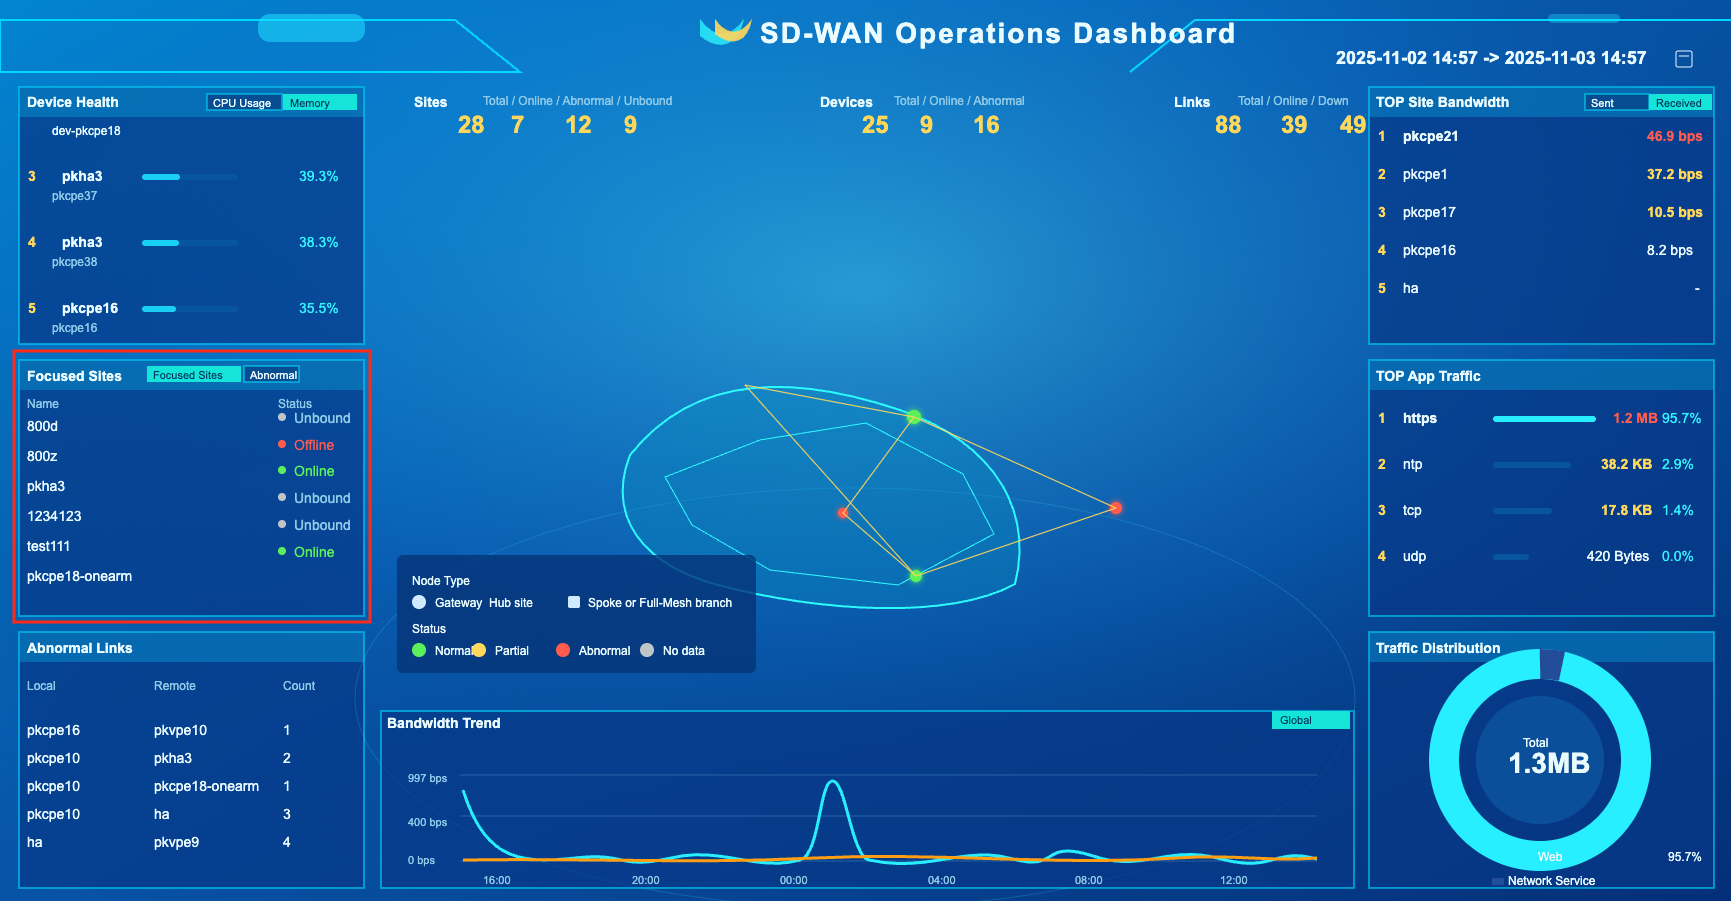
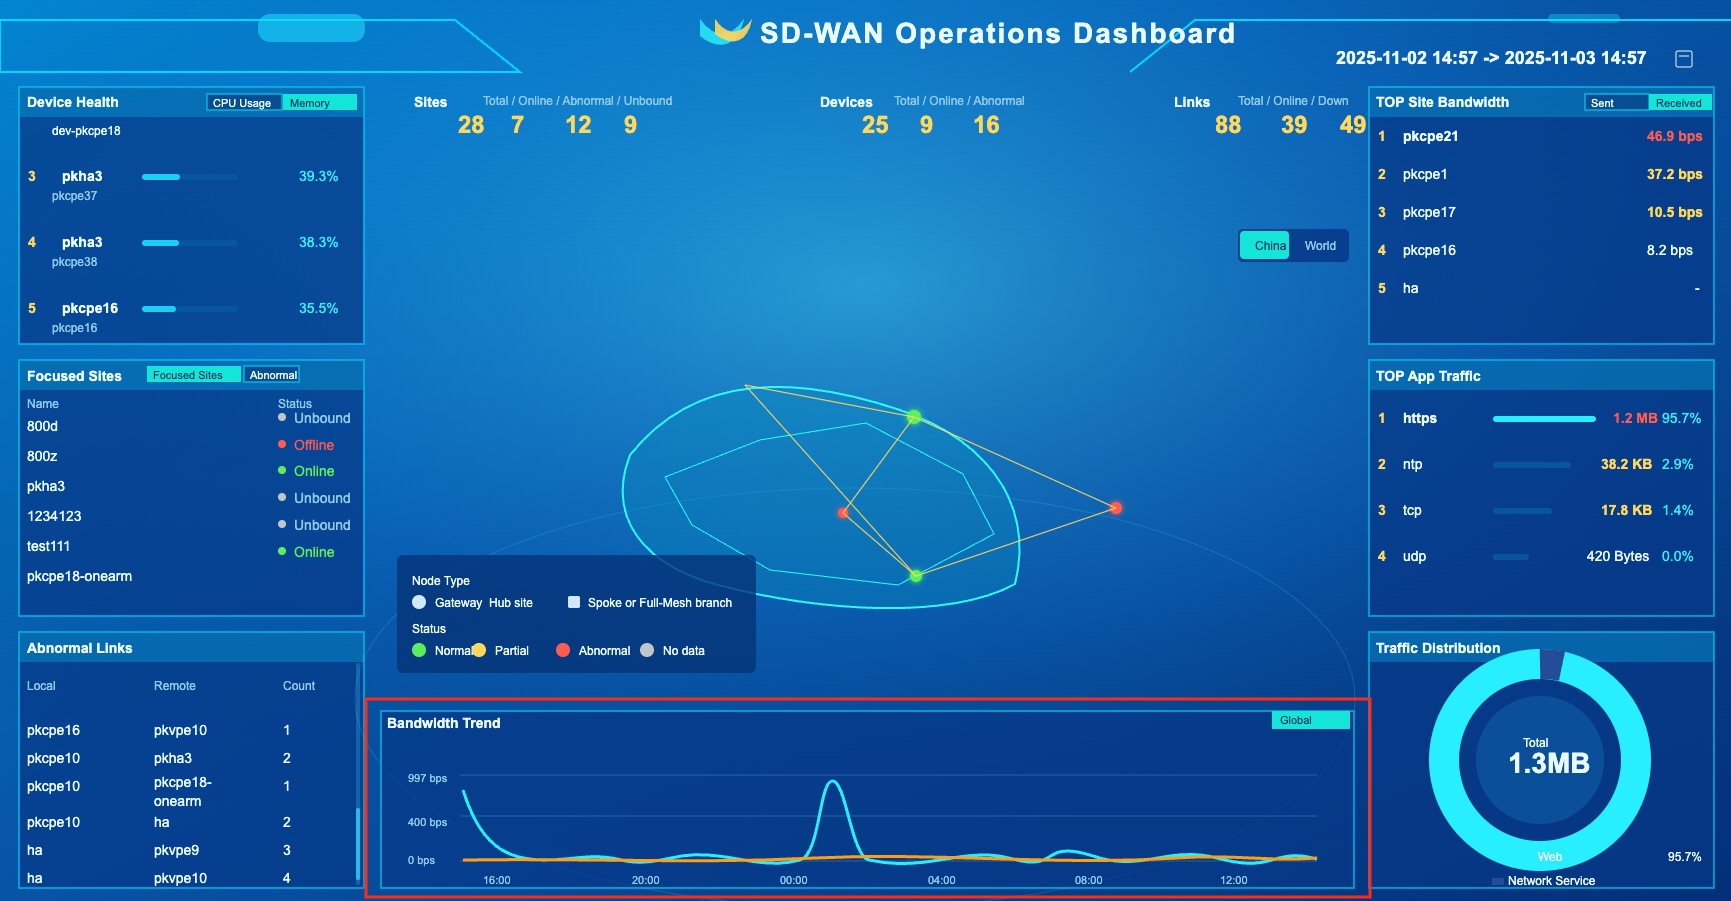
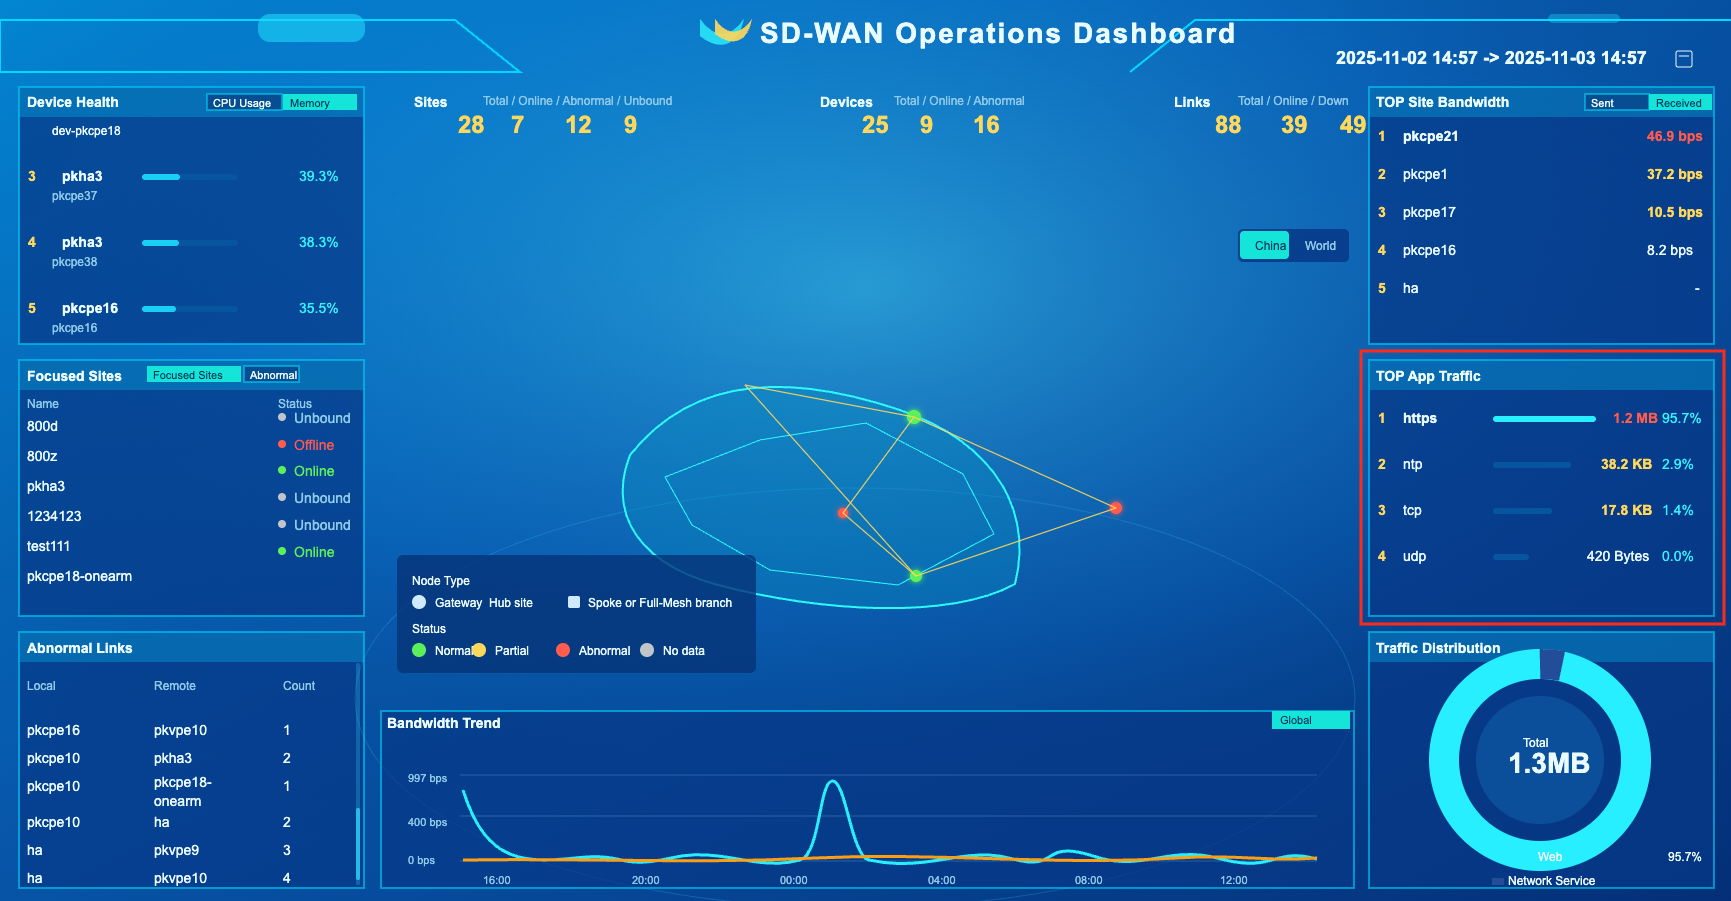
Overview
info
- Overview of network operations
The interface location is as shown below
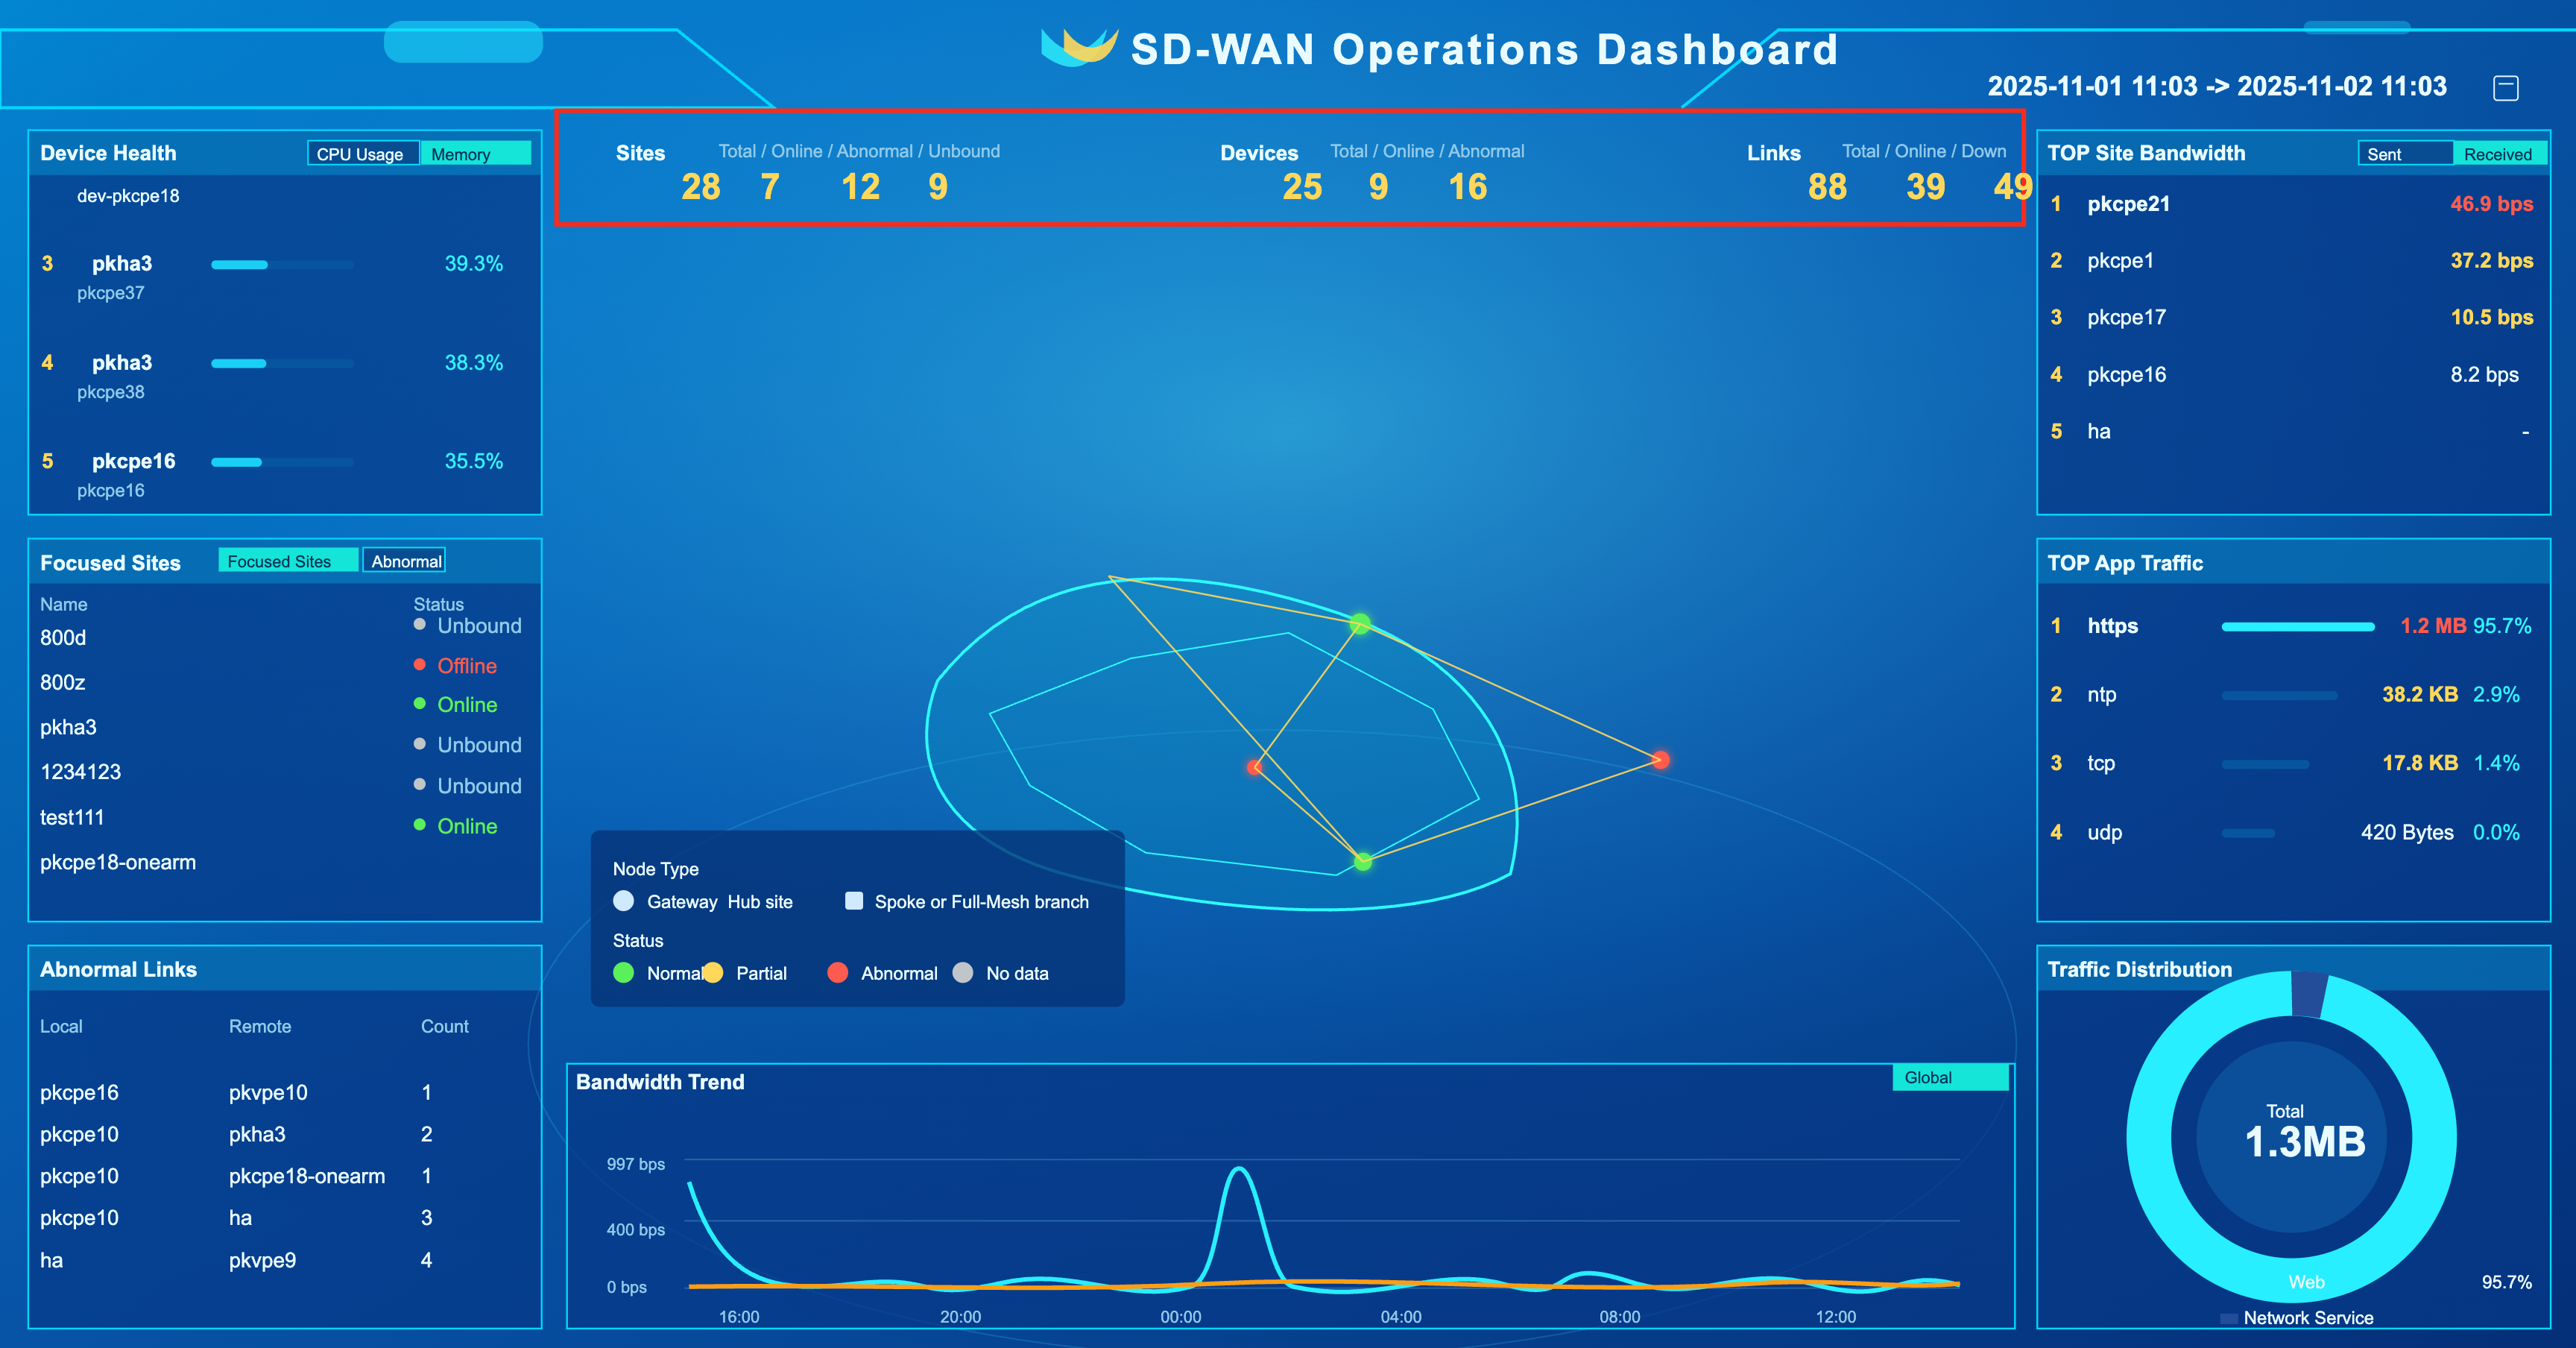
Site Overview

- Interface description
| Name | Description |
|---|---|
| Online | Number of online sites |
| Abnormal | Number of offline and partially online (HA) sites |
| Unbound | Number of unbound sites |
Device Overview

- Interface description
| Name | Description |
|---|---|
| Online | Number of online devices |
| Exception | Number of offline devices |
Link Overview

- Interface description
| Name | Description |
|---|---|
| Online | Number of online links |
| Disconnected | Number of offline links |
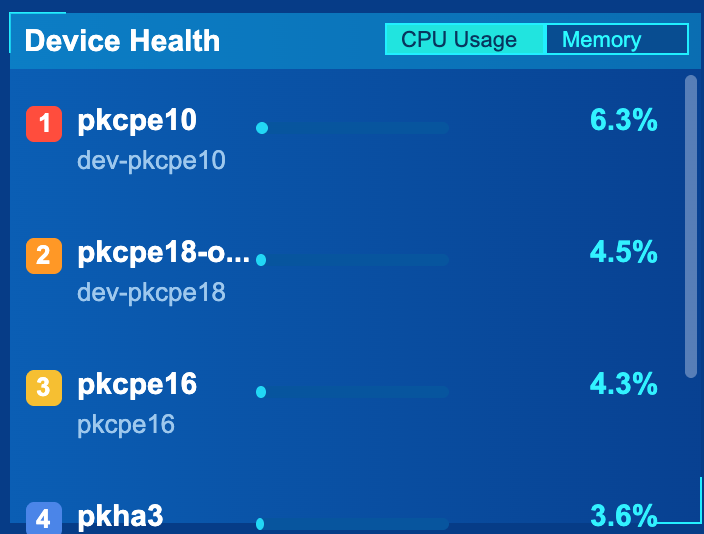
Device health
The interface location is as shown below

CPU usage
info
- Top 5 device CPU usage rankings within the time range
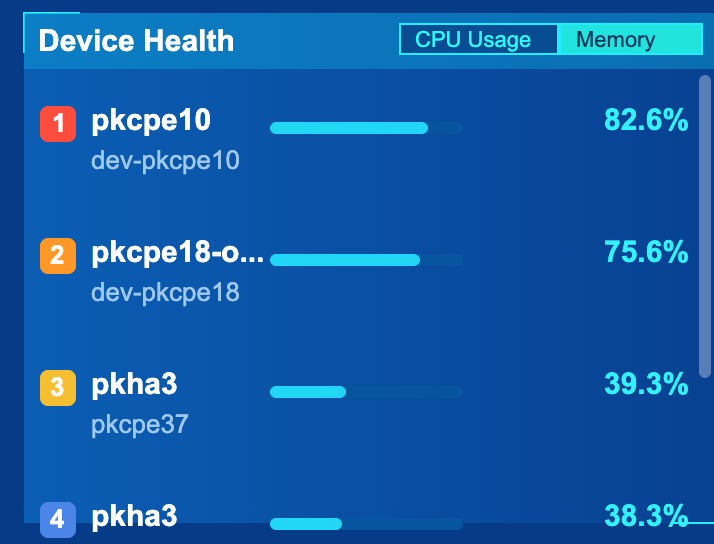
Memory usage
info
- Top 5 device memory usage rankings within the time range
Focus on sites
The interface location is as shown below
Focus on sites
info
- Focus on the status of the site, including: online, partially online (HA), offline, and unbound
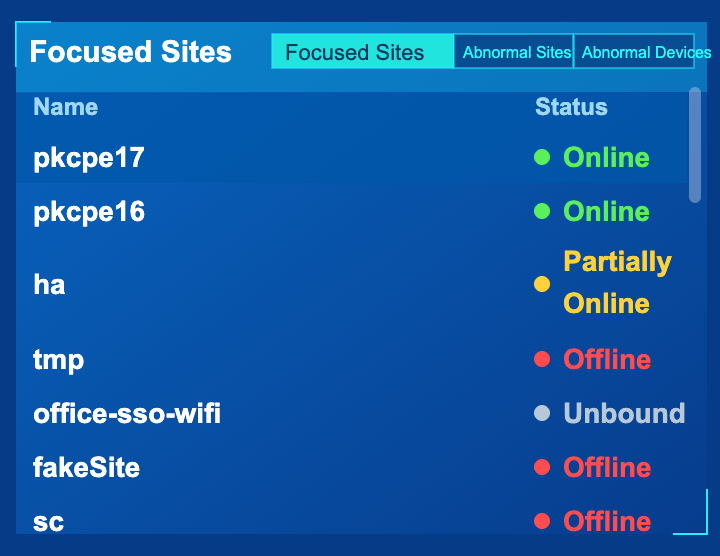
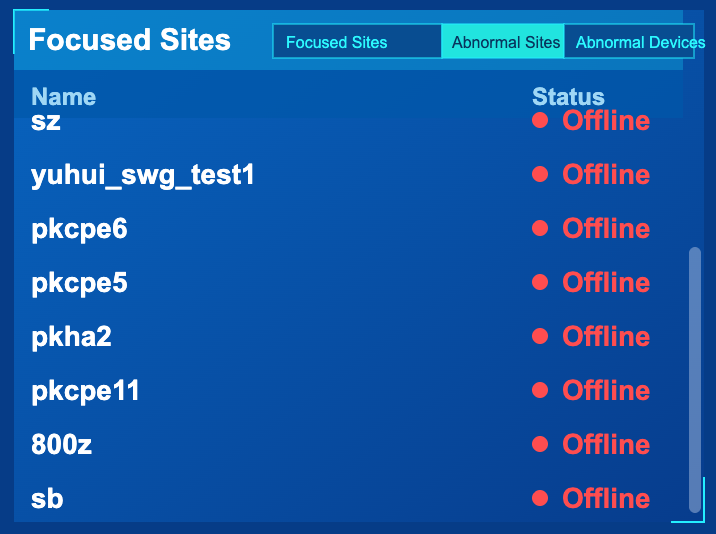
Abnormal site
info
- List abnormal sites, status includes: partially online (HA), offline
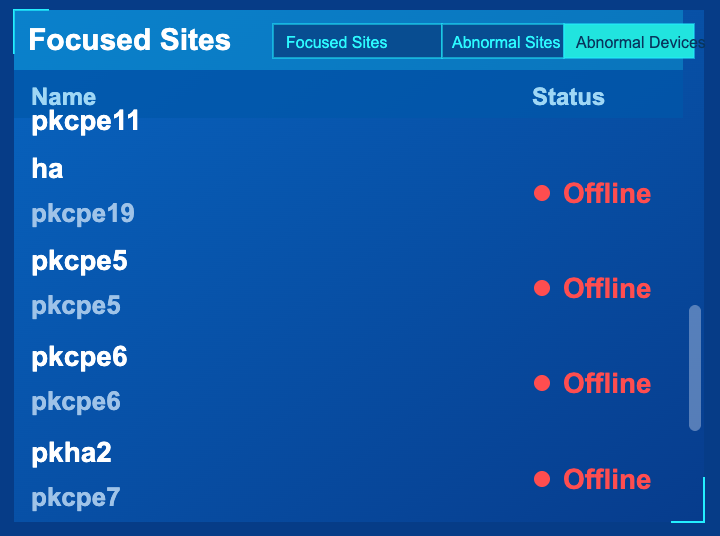
Abnormal device
info
- List offline devices
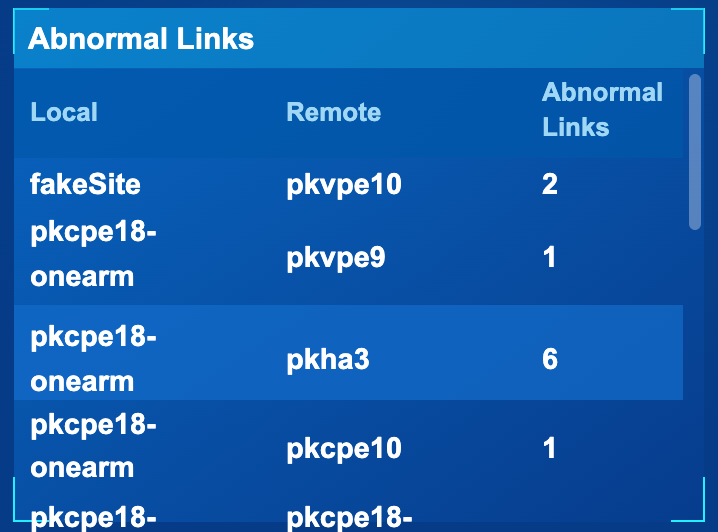
Abnormal link
The interface location is as shown below

info
- List the number of abnormal links on the same local end and the opposite end
Network topology
The interface location is as shown below

info
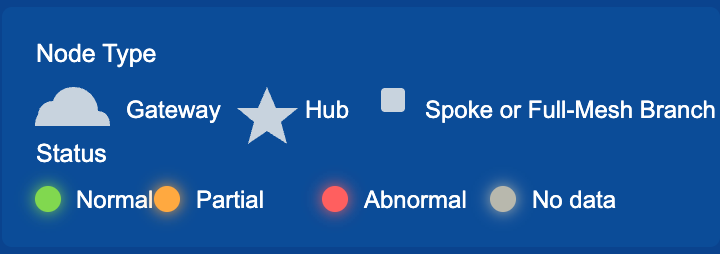
- Identify nodes and link information on the map, including: location, status, etc.
The graph and status of the node are as follows
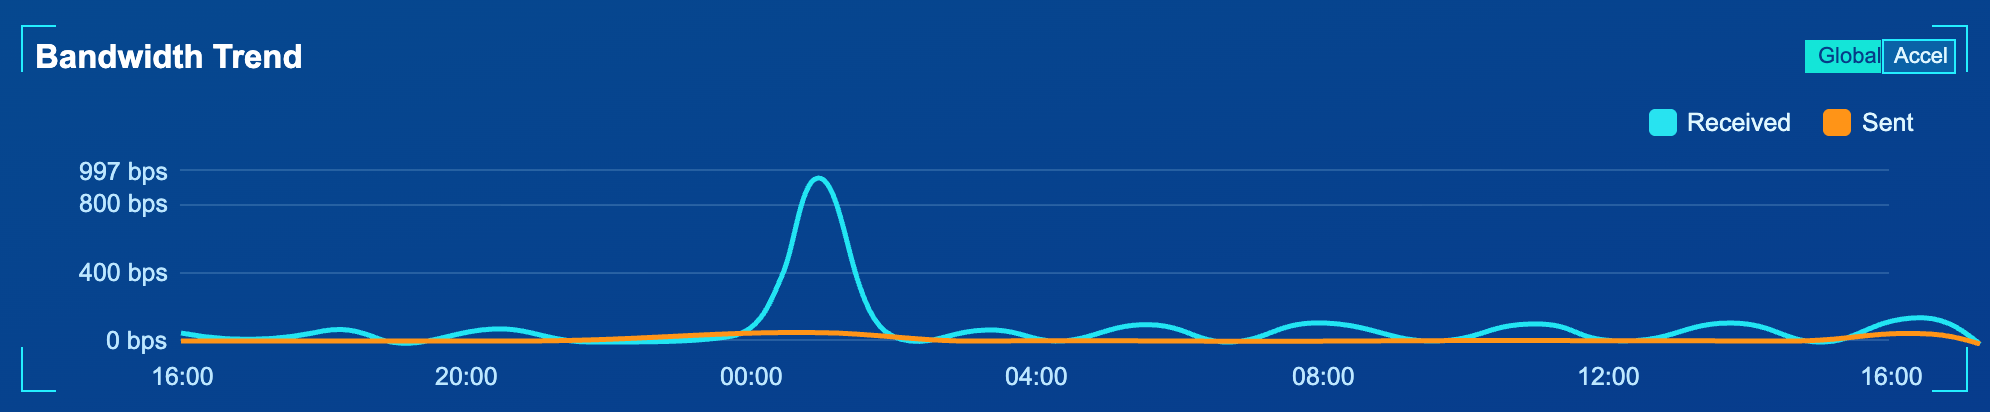
Bandwidth Trends
The interface location is as shown below
info
- Bandwidth trend within time range, unit: bps. Including: sending bandwidth, receiving bandwidth
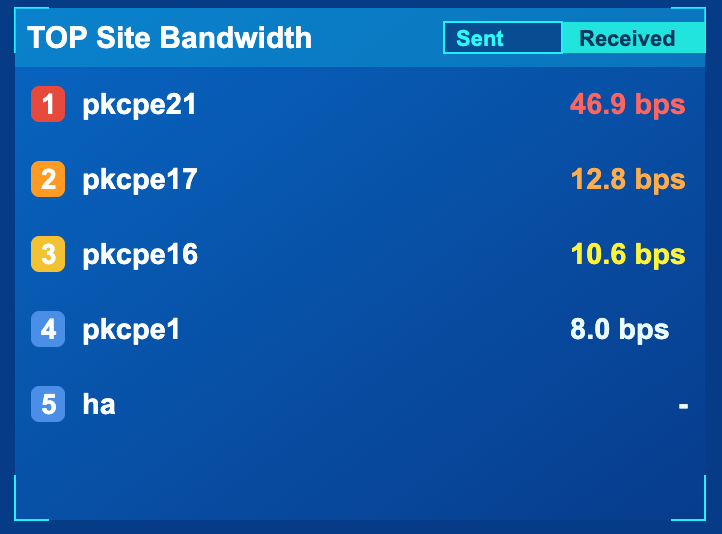
TOP site bandwidth
The interface location is as shown below
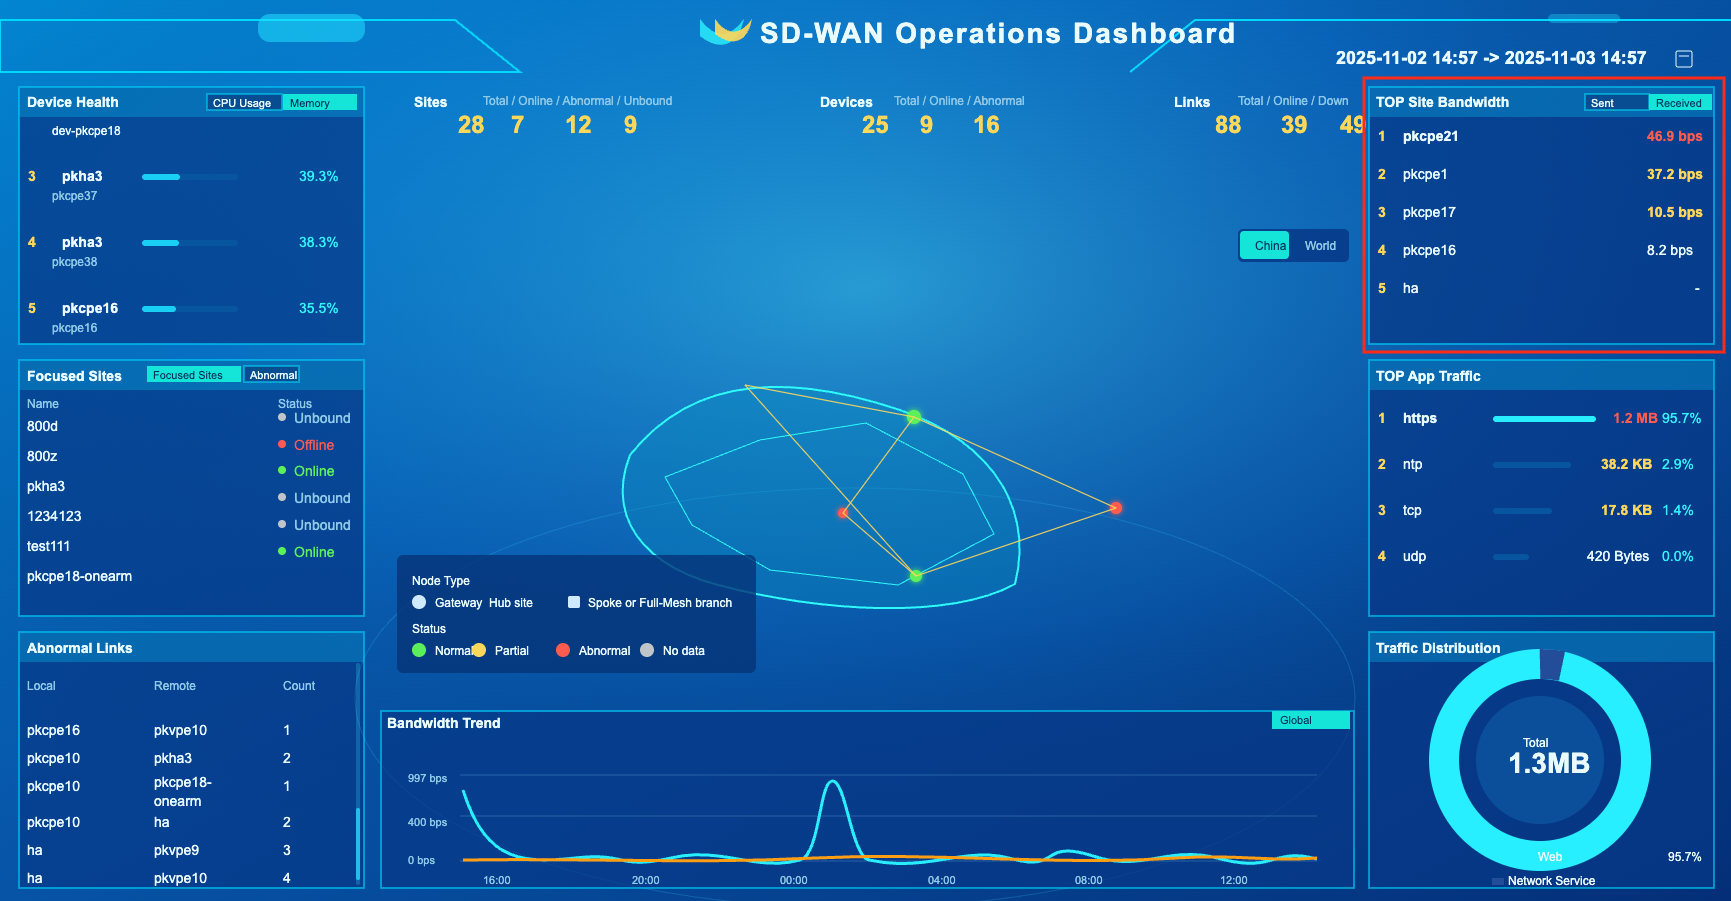
info
- Within the time range, the top 5 rankings of site bandwidth, unit: bps. Including: sending bandwidth, receiving bandwidth
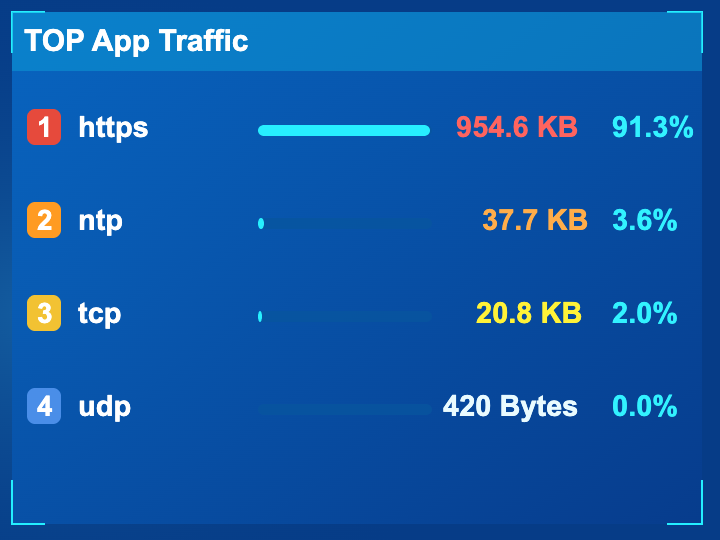
TOP application traffic
The interface location is as shown below
info
- Within the time range, the top 5 traffic rankings by application, unit: Byte
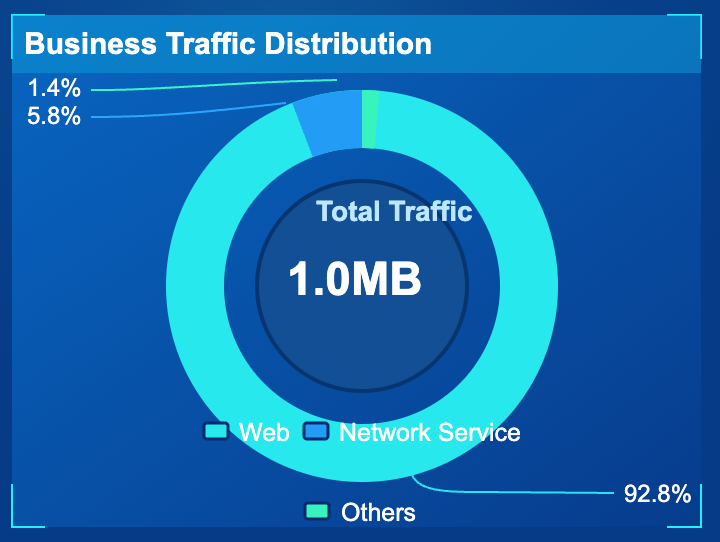
Business traffic distribution
The interface location is as shown below
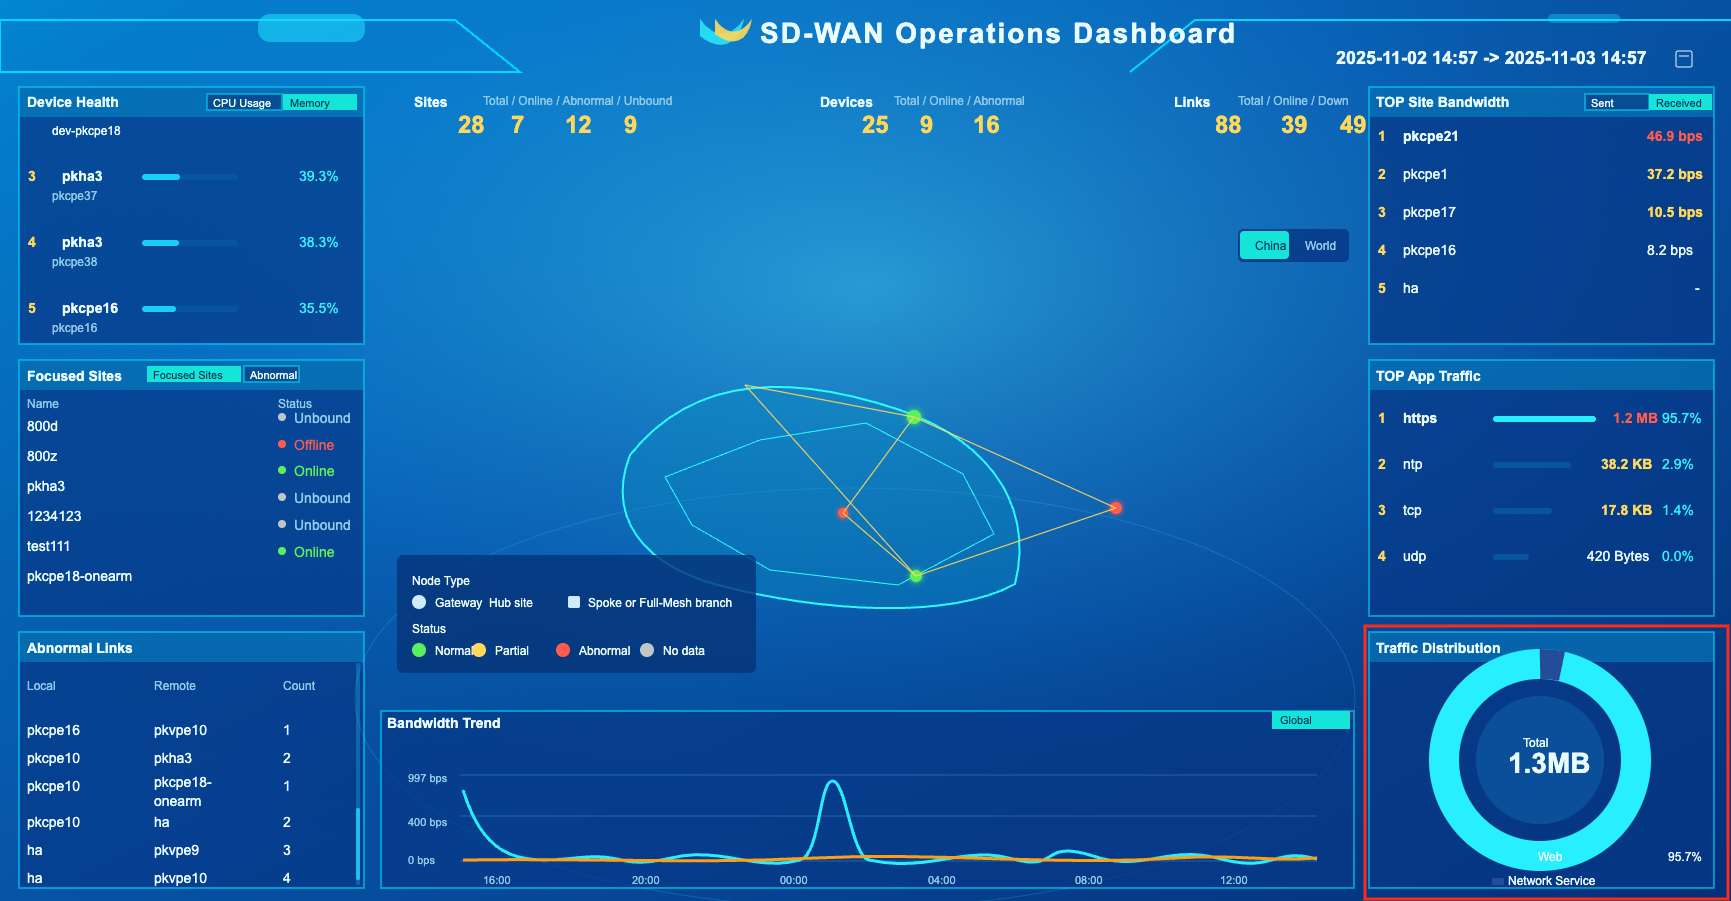
info
- Pie chart of traffic divided by business within time range